Thursday, September 25, 2014

Recover Deleted Custom Dashboards from vCenter Operations Manager

Some time back, I wrote an article highlighting the custom dashboards which are available out of the box with the release of vCenter Operations Manager 5.7. I have been asked questions about, how these dashboards can be recovered in case someone deletes them accidentally. 

In reality these dashboards are a bunch of XML files which get imported as dashboards, when you install the vCOps vAPP for the first time. A shell script is behind this import which executed the script post installation and start importing these out of the box dashboard in your vCenter Operations Manager instance.

Hence, if comes a scenario where you end up deleting these dashboards, you would need to find that shell script and run it all over again to import the dashboards back into your vCOps instance. Now that we know the science behind these dashboards, let's have a look as to where this shell script is located. 

I am using WinScp to login to the UI VM and browse through to the /usr/lib/vmware-vcops/user/conf/dashboards directory as shown in the screenshot. Here you will find the shell script "import-dashboards.sh"  and most importantly all the xml exports of the dashboards which can be imported back into vCOps individually as well.


If you wish to import all the dashboards, you would need to execute that shell script using either a ssh client such as putty or by taking a console connection to the UI VM. If you run this script it will import all the dashboards listed in the screenshot above and if any of those dashboard is already existing then you will have duplicate instances of same dashboards which in my opinion is not cool.

Hence if you want to recover only a subset of the listed dashboards, then either edit the shell script (if you are good with scripting) else just grab the xml file you want to import and use the IMPORT DASHBOARD option in the custom UI.


With this I will close this article and  get on with a 360 Degree Capacity Dashboard I am working on. Will share that for sure ;-)

Till then...


SHARE & SPREAD THE KNOWLEDGE!!


Building a VDI Custom Dashboard and Generic Scoreboard: Step-by-Step!


A few days back I added a new section to my blog which would bring new bloggers on-board as guest bloggers on vXpress. Today I am proud and happy to share the first post by a Guest Blogger on one of my favorite topic - "No prize for guessing: vCenter Operations Manager" .


This marathon post is by Anand Vaneswaranwho works as a Senior Technology Consultant with the End User Computing group at VMware.  He is an expert in VMware View, ThinApp, vCenter Operations Manager, and vCenter Operations Manager for View. So without further a-do let's see what Anand has to share with this blog post around his experience with the problems he is trying to solve using vCOps for View Dashboards.

This one-click high-level dashboard gathers the most important metrics in a typical VDI environment.  In the event of a production outage, this type of dashboard can be of monumental value.  I encourage you to replicate this dashboard using my example, or simply follow my lead in its setup but leverage the most important metrics, and therefore dashboards, that will be of use to you in your environment.


First, I’m going to structure my dashboard in the following manner (of course, you can structure yours any which way you like).


You can set up the widgets in the manner you want.  To display the number of tunneled sessions through the Security Servers, I’m going to set “Fixed Size” in Layout mode, “Box Height” to 75px, “Label Size” to 12, “Box Columns” to 3, and “Value Size” to 12.  I will name the widget “Security Server Connections,” turn the Self Provider to “On,” and Refresh Widget content to “On.” I will then search for my Security Servers by name in the “Search” field under “List.” However, you could very well sort by Resource Kit as opposed to “Resource” in Selector Mode and navigate to the View Security Servers under resource kind to find your Security Servers.


Once the widget is set up, it will look like this:


Moving on, I’m going to edit the “Health Status” widget right underneath it.  There is little customization needed in this widget, as indicated below, as this is going to be a Receiving Widget with the widget we just created above providing the data. 


Now, I’m going to set up the Interaction as follows:


Once the widget is set up, the resultant widget will look like this:


Moving on to display the Workload % of my Connection Servers on the top right of my dashboard, I will set up my widget in the following manner:


Once the widget is set up, the widget will look like this:


As well, I’m going to edit the “Health Status” widget right underneath it.  There is little customization needed in this widget, as indicated below, because this is going to be a Receiving Widget with the widget we just created above providing the data. 


After that, I’m going to set up the Interaction as follows:


Once the widget is set up, the widget will look like this:


My VDI environment has been segregated into two different vCenters: vCenter 9000 hosts the full-clone workload clusters while vCenter 9003 hosts the linked-clone workload clusters.  But I’m going to need to find a way to group these hosts into their appropriate vCenter (in vCOPS) so I can achieve this granularity when displaying data in my widgets.  

So this is where the built-in vCOPS feature of Resource Tags comes in handy.  To get there, I’m going to navigate to Environment > Environment Overview, and click the  'spanner' icon to manage tags.  Then, I’ll add a tag called “vCenter Hosts” and add Tag Values called “9000” and “9003”.


Once I’ve set up my tags, I will drag my ESXi hosts into the appropriate tags so that my final output looks like this:


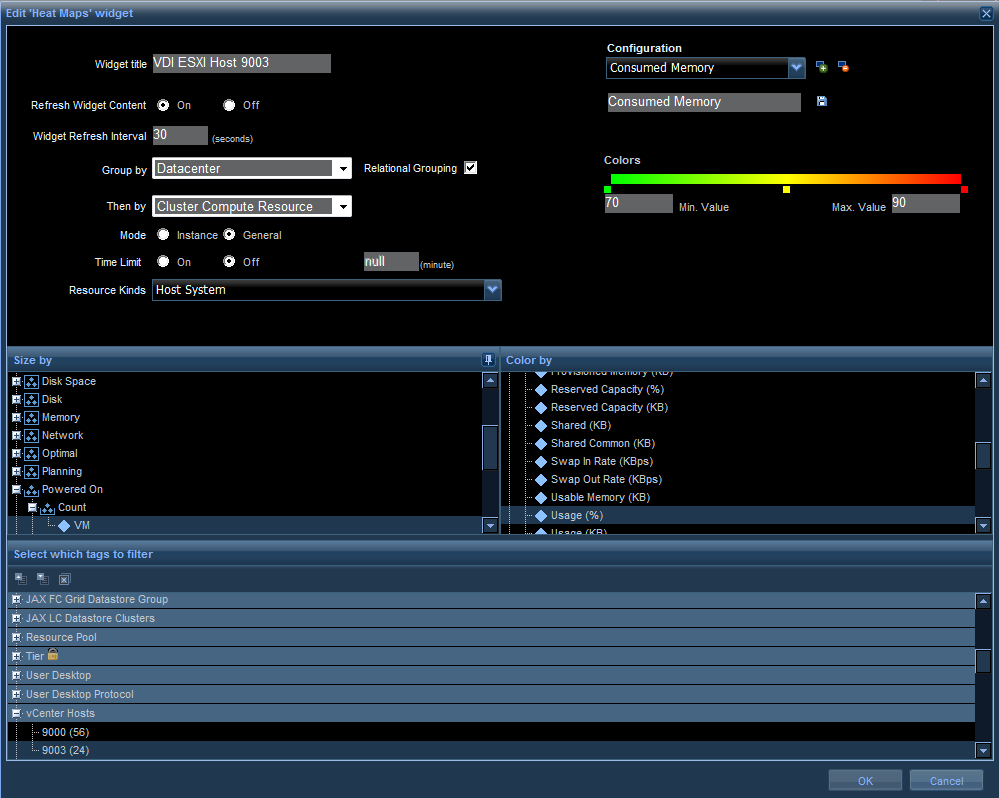
After this step, I’m ready to edit my Heat Map widgets.  First I will edit the Heat Map to the bottom left of the dashboard and set up the following Heat Map configurations:


Overall Workload


Consumed CPU


Consumed Memory


Now I’m going to replicate the same configurations on the heat map widget to the bottom right for my 9003 hosts.

Overall Workload


Consumed CPU


Consumed Memory


Now we move onto the bottom middle widget which I want to set up to monitor the performance and capacity of my datastore LUN’s.  First, I am going to perform a similar grouping of VDI LUN’s as either belonging to either 9000 or 9003 vCenter.  I’m also going to create another tag value for replica datastores so I have an easy way of filtering them out.  I will then drag my LUN’s to the appropriate tags.


Next, I’m ready to edit my Heat Map widget.  I am going to set up the Heat Map configurations as follows:

Storage Available


Performance


Density Non Repla


Density Repla


Finally, for the Heap Map widget that is situated on the top-middle of my dashboard, I am going to monitor resources on critical VDI servers.  Once again I’m going to set up my tag-and-drag objects into the dashboard as appropriate.


Next, I’m going to set up the following configurations on the Heat Map:

Server CPU


Server Memory


Server Disk


After completing all of those steps, we are done. And now we can reap the fruits of our labor with this final output which looks like this:


In summary, I’d like to share few things to keep in mind:

  • If you want a quick graphical representation of the overall high-level state of your environment in a troubleshooting circumstance, or merely show your manager with a quick at-a-glance view, the Generic Scoreboard, Health Status, and Heat Map widgets are your best friends.
  • Resource Tags are extremely helpful when you need to find a way to granularly segregate your objects, especially when you filter in the Heat Maps.
  • My last word of advice, and it may be obvious, but if you feel apprehensive about this task, I’ll tell you what I tell customers: vCOps is nothing but a bunch of customizable dashboards with a bunch of customizable widgets.  The widgets contain a bunch a customizable data that you can resize and chop any which way you like.  BOOM! There you have it.

In my next series, I will write about creating a custom dashboard that delves into details on current capacity for each of the High-Level configurations we have captured in this dashboard.

Before the post concludes - A special thanks to Anand. Please leave your comments and feedback for him if you like his post and appreciate the hard work behind writing this. Motivation is what keeps the community going :-)


Share & Spread the Knowledge! 


Thursday, September 18, 2014

Part 2 : VCDX - The Saga Of The Lost Title : The Defense Preparation

I would like to start with an apology for getting this article out a bit late as I am getting too much to do in my new role of a Solution Architect at VMware. In my last article I wrote about my experience with creating the design for my VCDX Application. As promised, I am coming back with the part 2 of the series which would talk about preparing for the VCDX Defense and the important lessons I learned during my preparation.

Just to recap, here are the three parts of this series:-


Part III - Design Defense (coming soon...)

I want to keep it simple by quickly listing down the areas which I think are critical while giving you an insight into my experience.


VCDX DEFENSE PREPARATION


  • POST DESIGN SUBMISSION - In my last post, I briefly touched upon this point. Once I submitted my VCDX design, I was relieved and decided to take a break for a few days. On the other hand I knew that I need to prepare my presentation for the VCDX defense in case my application gets selected. Before I knew, the month already passed away and I was invited for the defense. I started putting my presentation together just a week before I got my invite. This, I would say was the second BIGGEST mistake I made (The first one being the hurried submission of my application). To sum up this point, I would like to say that being a VCAP-DCA and VCAP-DCD (which make you eligible for a VCDX), it is next to impossible that your submitted design would be rejected. I don't have the numbers with me, but I have hardly seen/heard anyone getting rejected for Average Documentation. You would have done something seriously wrong if you fall in this category, but if you are reading this series then chances are that you have already learned from my mistakes ;-).... Keeping this in mind, make sure that as soon as you submit your application, you should execute the strategy of prepping up your presentation and do not let the momentum go by taking a break.

  • STUDY GROUP PLAN - While I have already touched upon the benefit of being in a study group in my last post, I would say that having a Study Group Plan in hand is very crucial. It is highly recommended that a calendar is made and agreed upon mutually by all the group members. This lock in is very important else it is very easy to digress from the topic when you do not have a planned discussion. Also, this will help the group members prepare for the day's topic and share their experiences, design scenarios, best practices and gotchas about the topic with each other. At this stage I must compliment my study group member and a great friend "Craig Kilborn". Craig was instrumental in the success of the study group as he shouldered the responsibility of leading the discussions and helped the rest of the members in the group. While creating the calendar for the study group, you should divide it into Four (4) parts, namely, Technical Topics, Mock Design Scenarios, Mock Troubleshooting Scenarios &  Mock Presentation. It is important to strike a balance between all the areas so that each participant of the group can get enough time to cover all the technical aspects, go through atleast 3 to 5 Troubleshooting & Design Scenarios and finally should be able to do atleast 2 mock presentations for the complete 90 minutes within the group. Please ensure that your group sizes are not less than 3 and not more than 5 to ensure enough time for each participant for any planned activity. Consider people from similar time zones as far as possible.

  • MOCK PRESENTATION - Mock presentations are a key to success for your VCDX defense and I was able to give 7 to 8 such presentations. With each presentation, I became stronger and discovered more about my design from the questions being asked. While this gave me new perspectives to the design, I realized that you will only gain a cent percent from a MOCK PRESENTATION if your mock panelist have reviewed your design inside-out. Remember, mock does not mean that people ask questions on what you are presenting, it means people ask you questions on what you have designed, documented & now presenting. Hence please ensure that you insist on giving mock presentations to people who know everything about your design. I did a mistake, you don't repeat it :-)

  • DESIGN CHANGES - The principle of "Only thing being constant is CHANGE" cannot fit more appropriately than in a VCDX Preparation. Even after you spend months in creating your design & presentation, you would continue to make changes on the basis of feedback, mocks, self-study and experiences. Once you have submitted your design, there is every possibility of finding a mistake in the submitted design. If this happens with you and I am sure it will, the first thing you do is NOT to PANIC. I am saying this from my 1st hand experience and trust me it is not a good situation to be in. Having said that, there are multiple ways to rectify your mistakes. Please notice my words when I say RECTIFY... Remember, I do not say cover up. A cover up would be the last thing on this earth you could do as it is next to impossible to escape from the sharp eyes and minds of the VCDX panelists. One should use the VCDX presentation as a tool to rectify the mistakes by giving a proper justification as to why a certain design decision was taken in the first place and why you decided to change it now. Sugar coating won't work here and honesty is the only option. I represented these mistakes by using an "ADJUSTMENTS" slide in my presentation deck. Having said all this, you should avoid any drastic design changes as the panel would not like to see an architecture completely different from what has been submitted for a review.  

  • PRACTICE MAKES EVERYONE PERFECT - This is true for VCDX preparation as well, however my mistake was to over practice the presentation and under practice the design scenario & the troubleshooting scenario. I realized that I was flawless and unstoppable while giving my presentation as I had done close to 8 Mocks before I finally presented, however I could have done better during the design scenario. The troubleshooting scenario was good, however it is important to follow a process in your mind else you can very easily lose points and interest of the panelists, if you are not asking the right questions in a logical way. In my opinion this comes with experience and practice. Practice more, because mostly, you would not have experience customers going into the nitty gritty of things in your day to day job of an architect. Give equal importance to all the sections of the defense and prepare well.


I hope the above mentioned points will help you learn from the best practices we followed as a group and the mistakes which I did during my preparation and make you a better prepared VCDX candidate. Will soon come out with the third and final part where I will discuss my experiences around the D-DAY for VCDX defense. 

Till then.. Stay Tuned!


Share & Spread the Knowledge!