As I am exploring vRealize Operations 6.1, I am unearthing the goodness of the new features which are introduced with this release. One of the biggest feature for me which the product delivers now is the new enhanced reporting feature. This reporting feature allows you to import a Custom Dashboard into a report. Yes you read it right!!

This was the single biggest ask by many of my customers for whom, I would create a custom dashboard. While the dashboards are priceless from a perspective of real time monitoring with the widgets such as Heat-maps, Health Widgets etc, the customers always wanted to have a feature where in they could automatically send out a report with the dashboard included to higher management or application users via email.
While the reporting engine in vRealize Operations 6.0.x is by far amazing, with 6.1 the solution also allows you to import a Dashboard into a Custom Report as publish them as reports.
Without further-ado let's have a quick look as to how you can do this:
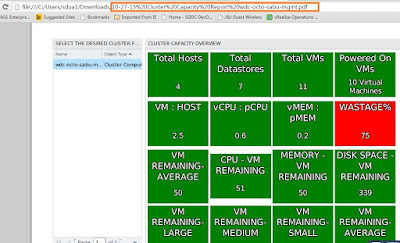
1- Let's say this is the dashboard which you want to publish in a Custom Report. This is a cluster capacity dashboard.
2- Click on Content - > Reports to open the report engine.
3- Click on the "+" sign under Report Templates to add a new Report.
4- Provide a Name and Description to begin with.
5- As a next step, you have the option to either add a VIEW or a DASHBOARD to the Report. Here is a drop-down which shows both the options.
6- Select Dashboard and now you will be able to see all the dashboards which you have in your vROps instance under Data Type. You can see the Cluster Capacity Dashboard here.
7- You need to DRAG & DROP this dashboard on the right pane to incorporate the same in the report.
8- On the next screen you have the option of selecting the report formats and the layout.
8- Finally you can customize the layout by adding images, footers etc and then save the report template.
9- You can see the new report we just created. Highlight the same an click on RUN button to execute the report.
10- You need to now select the Object on which you have to run the report. In this case, it would be a cluster and click on OK for the report to execute.
11- Once the report is processed, click on the Generated Reports Tab, and then click on the PDF link to down the report.
12- Once you open the PDF, you will see the cluster capacity dashboard in the report.
And that's it! You can schedule this report and send out to recipients automatically via email, or also dump it on a file share if you wish to.
Hope this helps you to use this FANTASTIC feature of custom reporting to meet the reporting needs of your business.
Do not forget to SHARE & SPREAD THE KNOWLEDGE!!


It doesnt work very well when the dashboard height is larger than the screen. The reports cuts off and only shows a portion of the charts. Do you know if there's a configuration for this?
ReplyDeleteHave you tried using the Landscape option?
DeleteIf you do a Capacity Utilization report you get a grey page with the word Loading in the middle. So not as impressive as I would have hoped.
ReplyDeleteShould have been more clear... Take a Capacity Utilization dashboard and place it into a report then run the report. It produces a grey page with the word "Loading" . On screen it is fine as a dashboard. It would seem there is a timeout function that is kicking the report off before it has truly loaded.
DeleteHi, I want to create custom dashboard for one specific application VMs showing capacity and performance utilization.
ReplyDeleteYou can use the Application option to create a custom application with different tiers. Then you can create dashboards where you can filter the widget object based on the applications group which you create. The option is available under Environment -> Applications to build new custom app groups.
DeleteHi Sunny, is it possible to combine between Dashboards and Views in a single custom report?
ReplyDeleteYou can plot all the views in your dashboard and then plot that dashboard in a report.
Delete