Welcome back to the Did You Know Series on vRealize operations Manager. As I mentioned in the first part of this series, the goal here is to unearth the Best Kept Secrets of vRealize Operations Manager.
This could be across features, functionalities, use cases, integrations, APIs or any tips or tricks which can help make day to day operations of SDDC easier and fun with vROps!
Today I will talk about how you can make troubleshooting an easier process with vROps. Troubleshooting as we all know is not a skill, it is a methodology. It would NOT be incorrect to say that each one of us has a different troubleshooting style. With vRealize Operations you can troubleshoot issues the way you like them. Some prefer OOTB dashboards, some like to create there own personalized views and some prefer to jump into what me and Iwan call God Mode aka the All Metric view in the product.
The All Metrics view of the product can easily become complex as it shows you all the metrics which are associated to an Object Type. If you look at vRealize Operations Manager 6.4, the product gave you some OOTB custom metric groups which can be used to list all common metrics around CPU, Memory and Disk. These were the OOTB options and might not fit all the needs. If you are on vROps 6.4, click on a VM object and click on All Metrics and you will see this:
You can see that apart from all metrics and all properties for the virtual machine, you can see 5 custom categories which list specific metrics which can be used for troubleshooting. As soon as I double click on CPU, I will see all the key metrics pertaining to the CPU Metric group in one shot on the right pane:
While this is a cool feature and make troubleshooting really simple, there was one use case which could not be solved here. If as an admin I wanted to create my own metric group where I want to focus on key metrics of my own choice, I was unable to create a metric group for same. While this was not possible with vROps 6.4, with the arrival of vROps 6.5, this feature is now available and now you can create your own custom metric groups with the metrics you like to use for troubleshooting.
I will show you how to create one custom group at virtual machine level:
1- Click on any virtual machine in your environment.
2- Click on All Metrics.
3- Click on the blue wheel and click on the Add Group option.
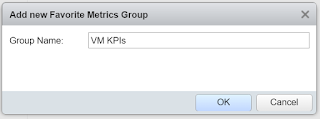
4- Provide a name. I will call it "VM KPIs"
5- Now you can drag and drop any metric from the all metrics group to this new created metric group:

Here are a few KPIs which I added in my vROps as they help me troubleshoot in God Mode with a single click.....
VM
KPIs
CPU
| Demand %
CPU
| Usage %
CPU
| CPU Contention %
CPU
| CO-Stop %
CPU
| Ready %
Memory
| Usage %
Memory
| Contention %
Memory
| Balloon %
Memory
| Swap In (KB)
Memory
| Compressed (KB)
Virtual
Disk | Aggregate of all instances | Commands Per Second
Virtual
Disk | Aggregate of all instances | Total Latency
Disk
Space | Snapshot | Virtual Machine Used (GB)
Guest
File System Stats | Total Guest File System Free (GB)
Network
I/O|Aggregate of all instances| Packets Dropped %
Host
System KPIs
CPU|CPU
Contention (%)
CPU|Demand
(%)
Memory|Contention
(%)
Memory|Total
Capacity (KB)
Memory|Consumed
(KB)
Memory|
Usage (%)
Network
I/O|Aggregate of all instances|Packets Dropped (%)
Cluster
KPIs
CPU|
CPU Contention (%)
CPU|Demand
(%)
CPU|Max
VM CPU Contention (%)
Memory|Balloon
(KB)
Memory|Contention
(%)
Memory|Max
VM memory Contention (%)
Memory|Usage
(%)
Go configure your vROps with the metrics you like and make troubleshooting an easy and fun process...
And yeah. Keep sharing!!


No comments:
Post a Comment