Welcome to the next post of the series on What's New with vRealize Operations Manager 6.6. In the last few parts of this series, I have been writing about the out of the box dashboards available in vROps 6.6.
In this post I will talk about the last out of the box category of Configuration & Compliance. I have skipped Workload Balance for now as it is more than a dashboard in vRealize Operations 6.6. I will share a series of post on that topic in the days to come.
Let us focus on the category of Configuration & Compliance. Here is how Configuration & Compliance shows up on the Getting Started Page:
The Configuration and Compliance category caters to the administrators who are responsible to manage configuration drifts within a virtual infrastructure. Since most of the issues in a virtual infrastructure are a result of inconsistent configurations, dashboards in this category highlight the inconsistencies at various levels such as Virtual Machines, Hosts, Clusters and Virtual Networks. You can view a list of configuration improvements that helps you to avoid problems that are caused because of misconfigurations.
Your IT security teams can also measure your environment against the vSphere hardening best practices to ensure that your environment is fully secured and meets all the compliance standards.
Key questions these dashboards help you answer are :
- Are the vSphere clusters consistently configured for high availability and optimal performance?
- Are the ESXi hosts consistently configured and available to use?
- Are the Virtual Machines sized and configured as per recommended best practices?
- Are virtual switches configured optimally?
- Is the environment configured in accordance with the vSphere Hardening Guide?
Let us look at each of these dashboard and I will provide a summary of what these dashboards can do for you along with a quick view of the dashboard:
Cluster Configuration
The Cluster Configuration Dashboard provides you a quick overview of your vSphere cluster configurations. It highlights the areas which are important to deliver performance and availability to your virtual machines. The dashboard quickly highlights if there are clusters which are not configured for DRS, HA or Admission Control to avoid any resource bottlenecks or availability issues in case of a host failure.
The heatmap on this dashboard, quickly identifies if you have hosts where vMotion was not enabled as this would not allow the VMs to move from or to that host. This could cause potential performance issues on the VMs living on that host if the host gets too busy. The dashboard also provides you a quick view of how consistently your clusters are sized and whether the hosts on each of those clusters are consistently configured.
The Cluster Properties view in this dashboard allows you to easily report on all these parameters by simply exporting the data and share the same with relevant stakeholders within your organization.
Host Configuration
The Host Configuration dashboard provides you a quick overview of your ESXi host configurations and capture inconsistencies to take corrective actions. Along with configurations, the dashboard measures the ESXi hosts against the vSphere best practices and calls out if it finds a deviation which can impact the performance or availability of your virtual infrastructure.
While you can always view this data using the dashboards, the ESXi Configuration view on this page allows you to export this data and share the same with administrator responsible to manage the hosts.
Network Configuration
The Network Configuration dashboard provides a detailed view of virtual switch configuration and utilization. On selecting a virtual switch you can see the list of ESXi hosts, DV port Groups and virtual machines which are being served by the select switch.
You can easily identify any misconfigurations within various network components by reviewing the properties listed in the views within the dashboard. The drill down to the virtual machine levels allows you to track important information such as IP address and MAC address assigned to the virtual machines.
A network administrator can use this dashboard to get a visibility into the virtual infrastructure network configuration.
VM Configuration
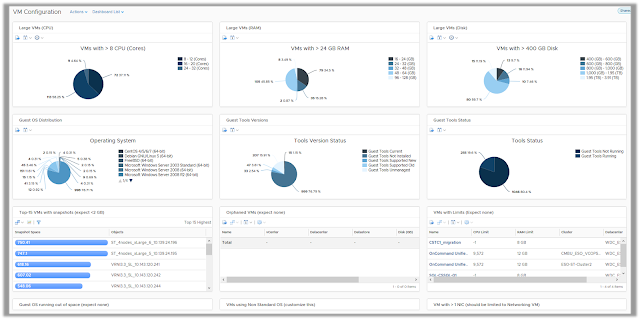
The Virtual Machine Configuration dashboard focuses on highlighting the key configurations of the virtual machines in your environment. The goal of this dashboard is to help you find inconsistencies of configuration within your virtual machines in order to take quick remediation measures. This helps you safeguard the applications which are hosted on these virtual machines by avoiding potential issues due to misconfigurations.
Some of the basic issues the dashboard focuses on includes identifying VMs running on older VMware tools versions, VMware tools not running or virtual machines running on large disk snapshots. VMs with such symptoms can lead to potential performance issues and hence it is important to ensure that they do not deviate from the defined standards.
This dashboard is complimented with an out of the box report named "Virtual Machine Inventory Summary" which can be used to report the configurations highlighted on this dashboard for quick remediation.
vSphere Hardening Compliance
The vSphere Hardening Compliance dashboard measures you environment against the vSphere Hardening Guide and lists down the objects which are non-compliant. You can see the trend of High Risk, Medium Risk and Low Risk violations and see the overall compliance score of your virtual infrastructure.
The dashboard also allows you to drill down into various components to check compliance for your ESXi hosts, Clusters, Port Groups and virtual machines using heatmaps.
Each non-compliant object is listed in the dashboard with recommendations on remediation required to secure your virtual infrastructure.
In case you are like me, and don't like to READ. You can see the dashboards in action in this video playlist:
⏩See all dashboards in action here.
⏩See all dashboards in action here.
More to come.. Stay Tuned!!


No comments:
Post a Comment