Overview
Whether it is containers or virtual machines, the end goal of organizations is to have a highly available, reliable and a scalable platform to run their business applications. With vSphere 7.0, VMware provides a unified platform to run your applications, by leveraging vSphere with Kubernetes.

In a previous post, we shared how vRealize Operations 8.1 & vRealize Operations Cloud can easily discover this new platform. Once discovered, the powerful analytics in vRealize Operations, unlock the use cases of monitoring, troubleshooting & capacity management for these new constructs. In the screenshot from my environment, you can see the newly discovered objects automatically tied to the vCenter inventory.

With this post, we will explore how vRealize Operations and vRealize Operations Cloud can monitor Tanzu Kubernetes cluster to provide your central IT teams with Full Stack Observability, from upstream Kubernetes applications; SDDC infrastructure, all the way down to the physical infrastructure. This will give the peace of mind you need to run your business applications with zero-blind spots and complete control.
What is a Tanzu Kubernetes cluster?
A Tanzu Kubernetes cluster is deployed using VMware Tanzu Kubernetes Grid. provides a consistent, upstream implementation of Kubernetes, that is tested, signed, and supported by VMware. A Tanzu Kubernetes cluster is an opinionated installation of Kubernetes open-source software that is built and supported by VMware.
Whether you deploy a Tanzu Kubernetes cluster on vSphere 7.0 using Tanzu Kubernetes Grid Service for vSphere, on AWS natively using Tanzu Kubernetes Grid or on VMware Cloud on AWS using Tanzu Kubernetes Grid Plus, vRealize Operations (On-Prem & Cloud), provides deep visibility into this new world. As central IT teams start to manage these Kubernetes environments, they can simply extend their existing investment in vRealize products to this new world and empower their teams to have an end to end visibility into business applications comprising of traditional VM based apps and modern microservices-based apps.
Monitoring Kubernetes with vRealize Operations
Prerequisites
Let's start with the simple pre-requisites:
- vRealize Operations Cloud or vRealize Operations 8.1.
- vRealize Operations Container Management Solution located on VMware Solution Exchange. For vRealize Operations (on-prem), follow the steps here to install the management pack. For vRealize Operations Cloud, simply raise a Service Request to have a VMware SRE enable this on your instance.
- A Kubernetes cluster deployed by Tanzu Kubernetes Grid.
- A copy of the vrops-cAdvisor.yaml file available here. vRealize Operations uses opensource cAdvisor to collect additional metrics and properties of Kubernetes objects by running as a DaemonSet in a sidecar container.
Prepping a Kubernetes Cluster for Monitoring
In my example, I am leveraging the awesome work done by William Lam, with his Tanzu Kubernetes Grid Demo Appliance fling and his blog post that explains how to leverage this appliance to deploy Kubernetes clusters on VMware Cloud on AWS. In addition to that, I would be using my instance of vRealize Operations Cloud. Let's get started.
With my Tanzu Kubernetes Grid Demo Appliance, I am pre-authenticated to my VMC on AWS SDDC. The first cluster that Tanzu Kubernetes Grid deployed here is a Management Cluster and in addition to that, I have deployed a couple of guest clusters for test and production use. Here are the clusters in my environment:
To list all available Kubernetes contexts, you can use the following command:
kubectl config get-contexts

I have already configured these 3 clusters to be monitored within vRealize Operations Cloud using the container management solution. You can see in the screenshot below:

Let's deploy a new Kubernetes Cluster and then we will add that to vRealize Operations Cloud for monitoring.
Step 1 - We will deploy a small development cluster using the following command
tkg create cluster --plan=dev tkg-cluster-03

Alright looks like my Kubernetes cluster "tkg-cluster-03" is up and running.
Step 2 - Let's create a vrops-cAdvisor.yaml file on this cluster and run it as a DaemonSet. Run the following commands
Switch context to the newly deployed cluster by running the command
kubectl config use-context tkg-cluster-03-admin@tkg-cluster-03
![]()
Now let's switch to the temp directory and create a vrops-cAdvisor.yaml file using VI command. You can choose to create this file elsewhere as well. Copy the content from the following text into the file into your vrops-cAdvisor.yaml file
![]()
If you wish, you can change the namespace where you want to deploy cAdvisor by editing the namespace option in the text. I am using the namespace named kube-system
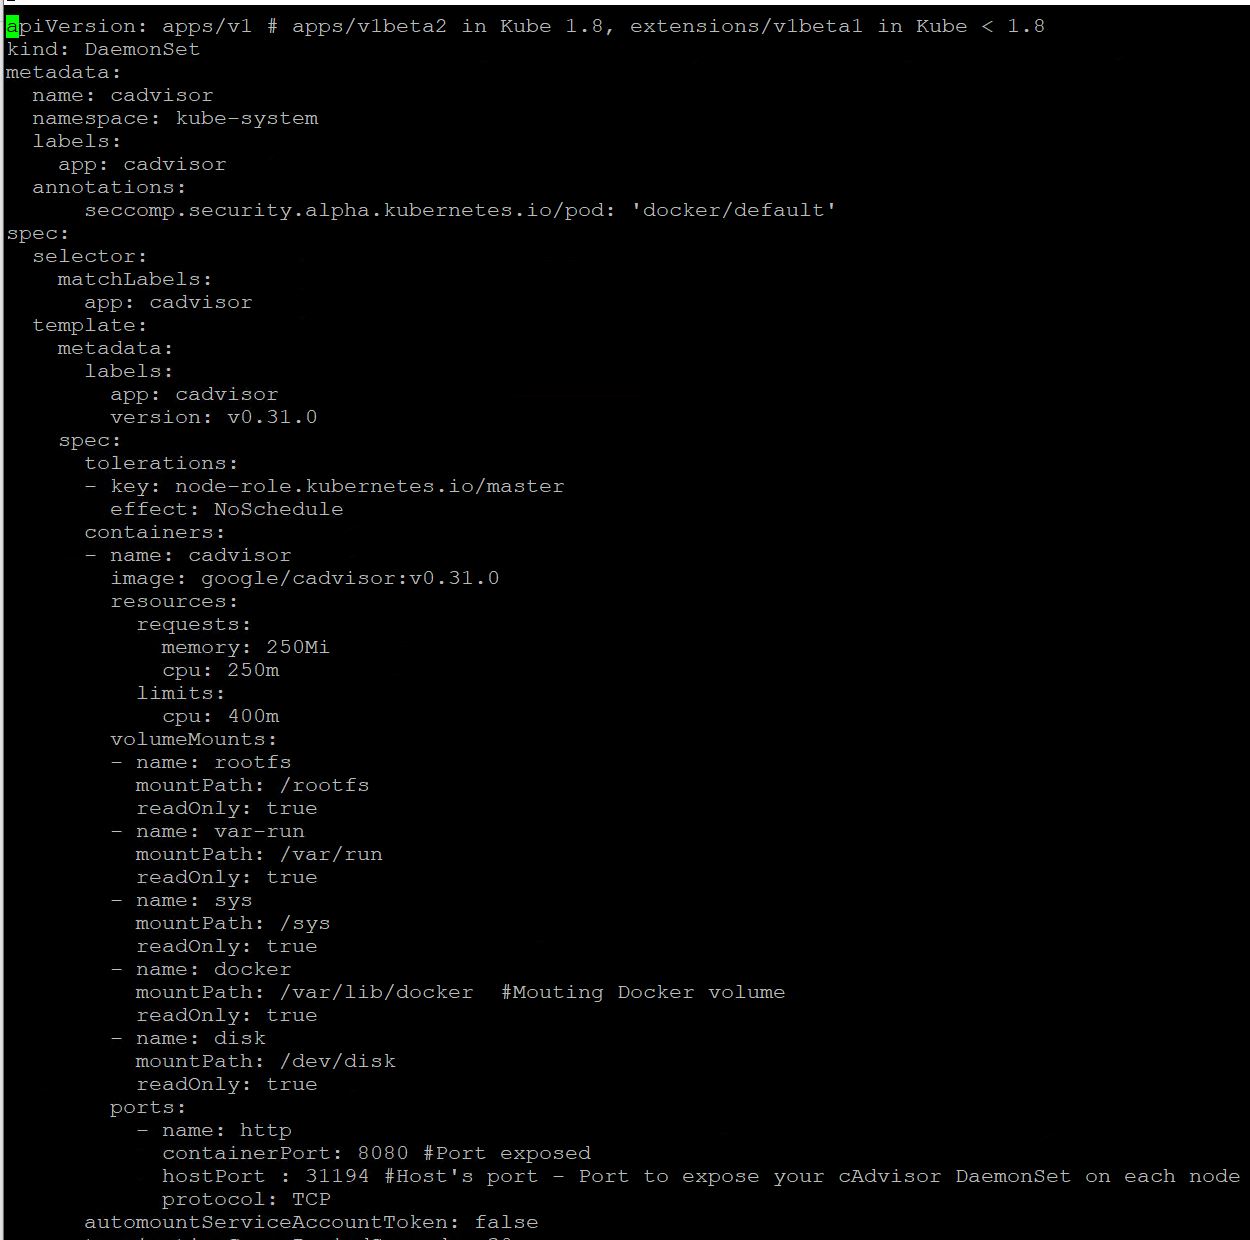
Save the file using wq! and then lets run the following command to run the cAdvisor as a DaemonSet
kubectl apply -f vrops-cAdvisor.yaml
![]()
Alright, the cAdvisor sidecar is deployed. That was simple. You can run the following command to see if the containers are running
kubectl -n kube-system get pod

Step 3 - We would need the IP Address and the Credentials for this cluster to add this to vRealize Operations. This information is available in the config file. Run the following command to read the config file.
less .kube/config
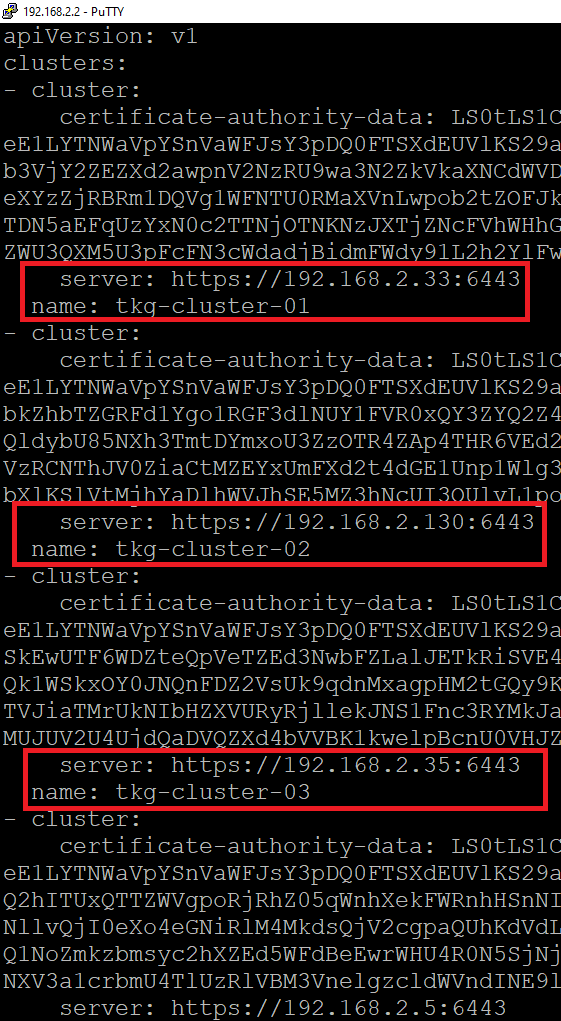
We need 2 things from this config file.
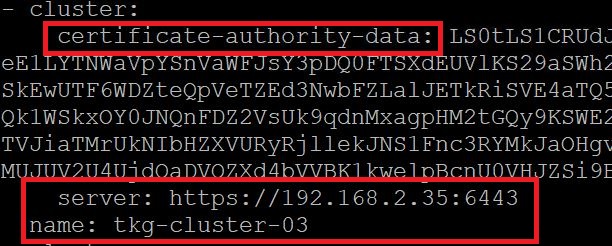
- The IP Address of the newly deployed Kubernetes cluster. You can see all the guest clusters here and the latest one named "tkg-cluster-03" with its server URL : "https://192.168.2.35:6443."
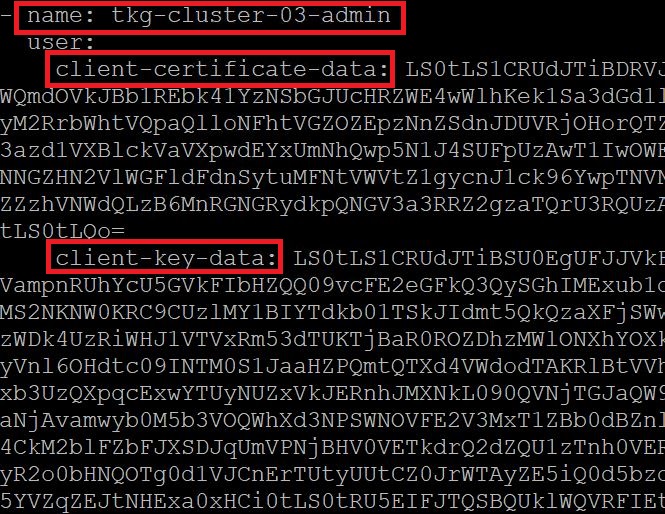
- We need a way to authenticate against this guest cluster. vRealize Operations support following. For more information, see Kubernetes Authentication.
In my case, I will use the Client Certification Auth. Just copy the following 3 tokens and keep them, we will use them later. This part can be tricky so make sure you have the right tokens if using Client Cert Auth. You would need the following tokens Certificate Authority Data, Client Certificate Data and Client Key Data as shown below. Ensure to use the tokens for tkg-cluster-03
Configure Kubernetes Adapter in vRealize Operations
Now that we have all the ingredients, let's get cooking.
Step 1 - Let's add this to vRealize Operations Cloud to begin monitoring. Click on Administration -> Other Accounts -> Click Add Account.
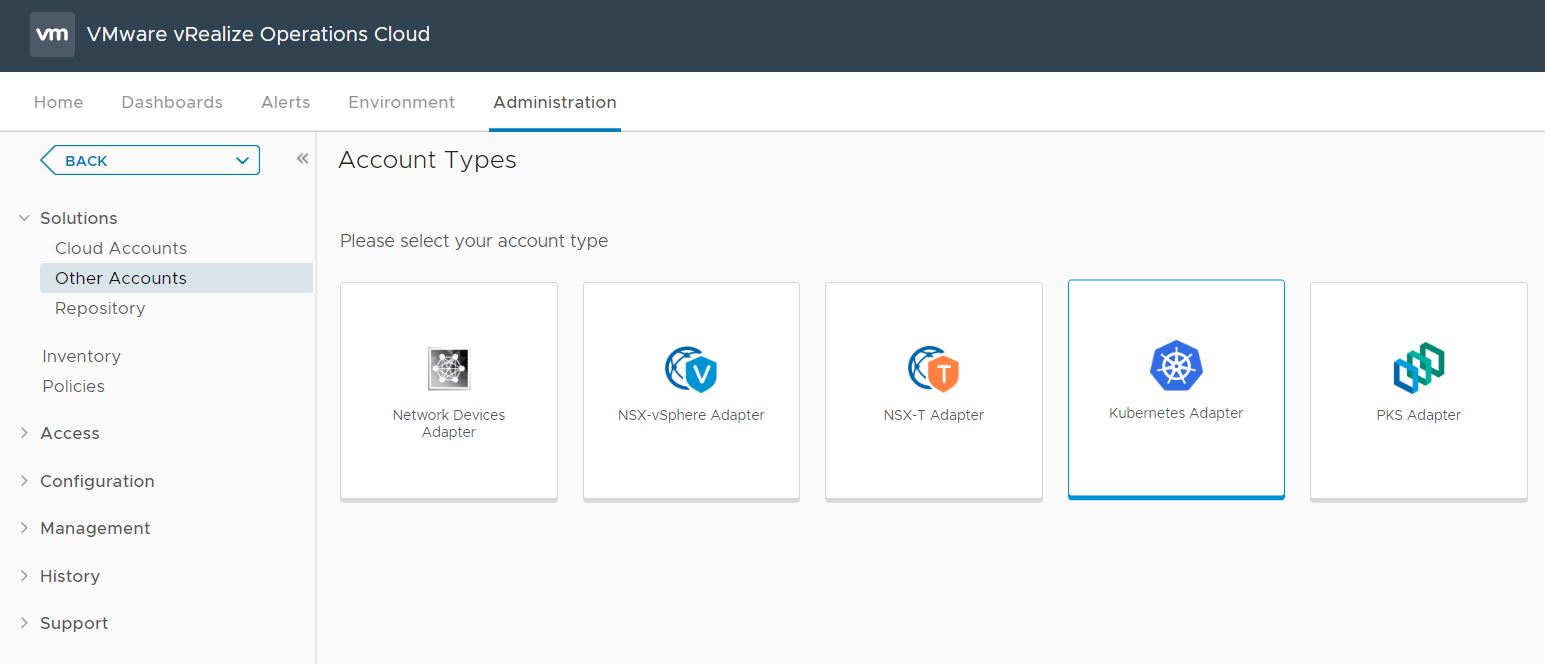
Step 2 - Select Kubernetes Adapter to fill in the following details. You can also see how I created the credentials using the cert data used before.
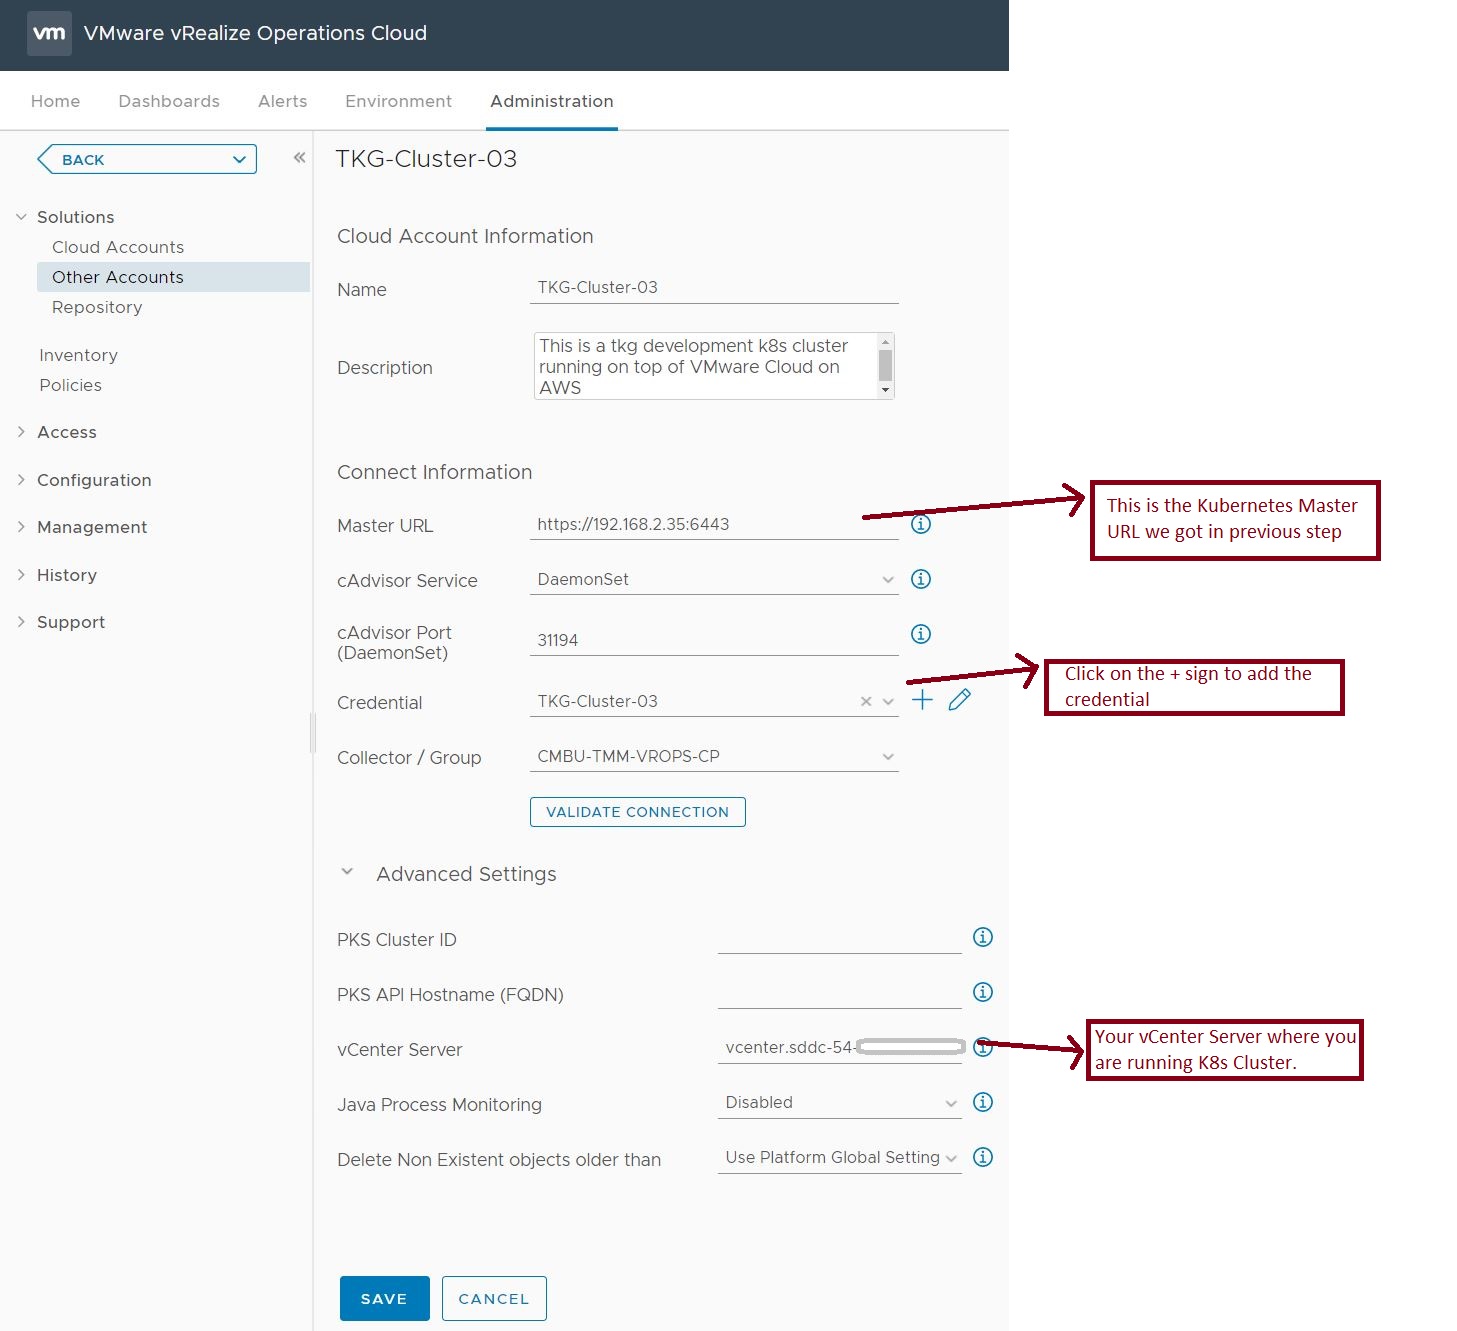

Note - The vCenter Server Advanced Setting step is optional, if your Kubernetes Cluster is running on vSphere like mine, you can simply add the vCenter Server here. If you are monitoring this vCenter Server with the same instance of vROps, the Container Solution will automatically connect the Kubernetes Nodes to vCenter Virtual Machines.
That's it. just 2 steps :-)
Using the Kubernetes Overview Dashboard and Troubleshooting Workbench for containers
This one is out of the box. Click on Dashboards -> Kubernetes Environment -> Kubernetes Overview
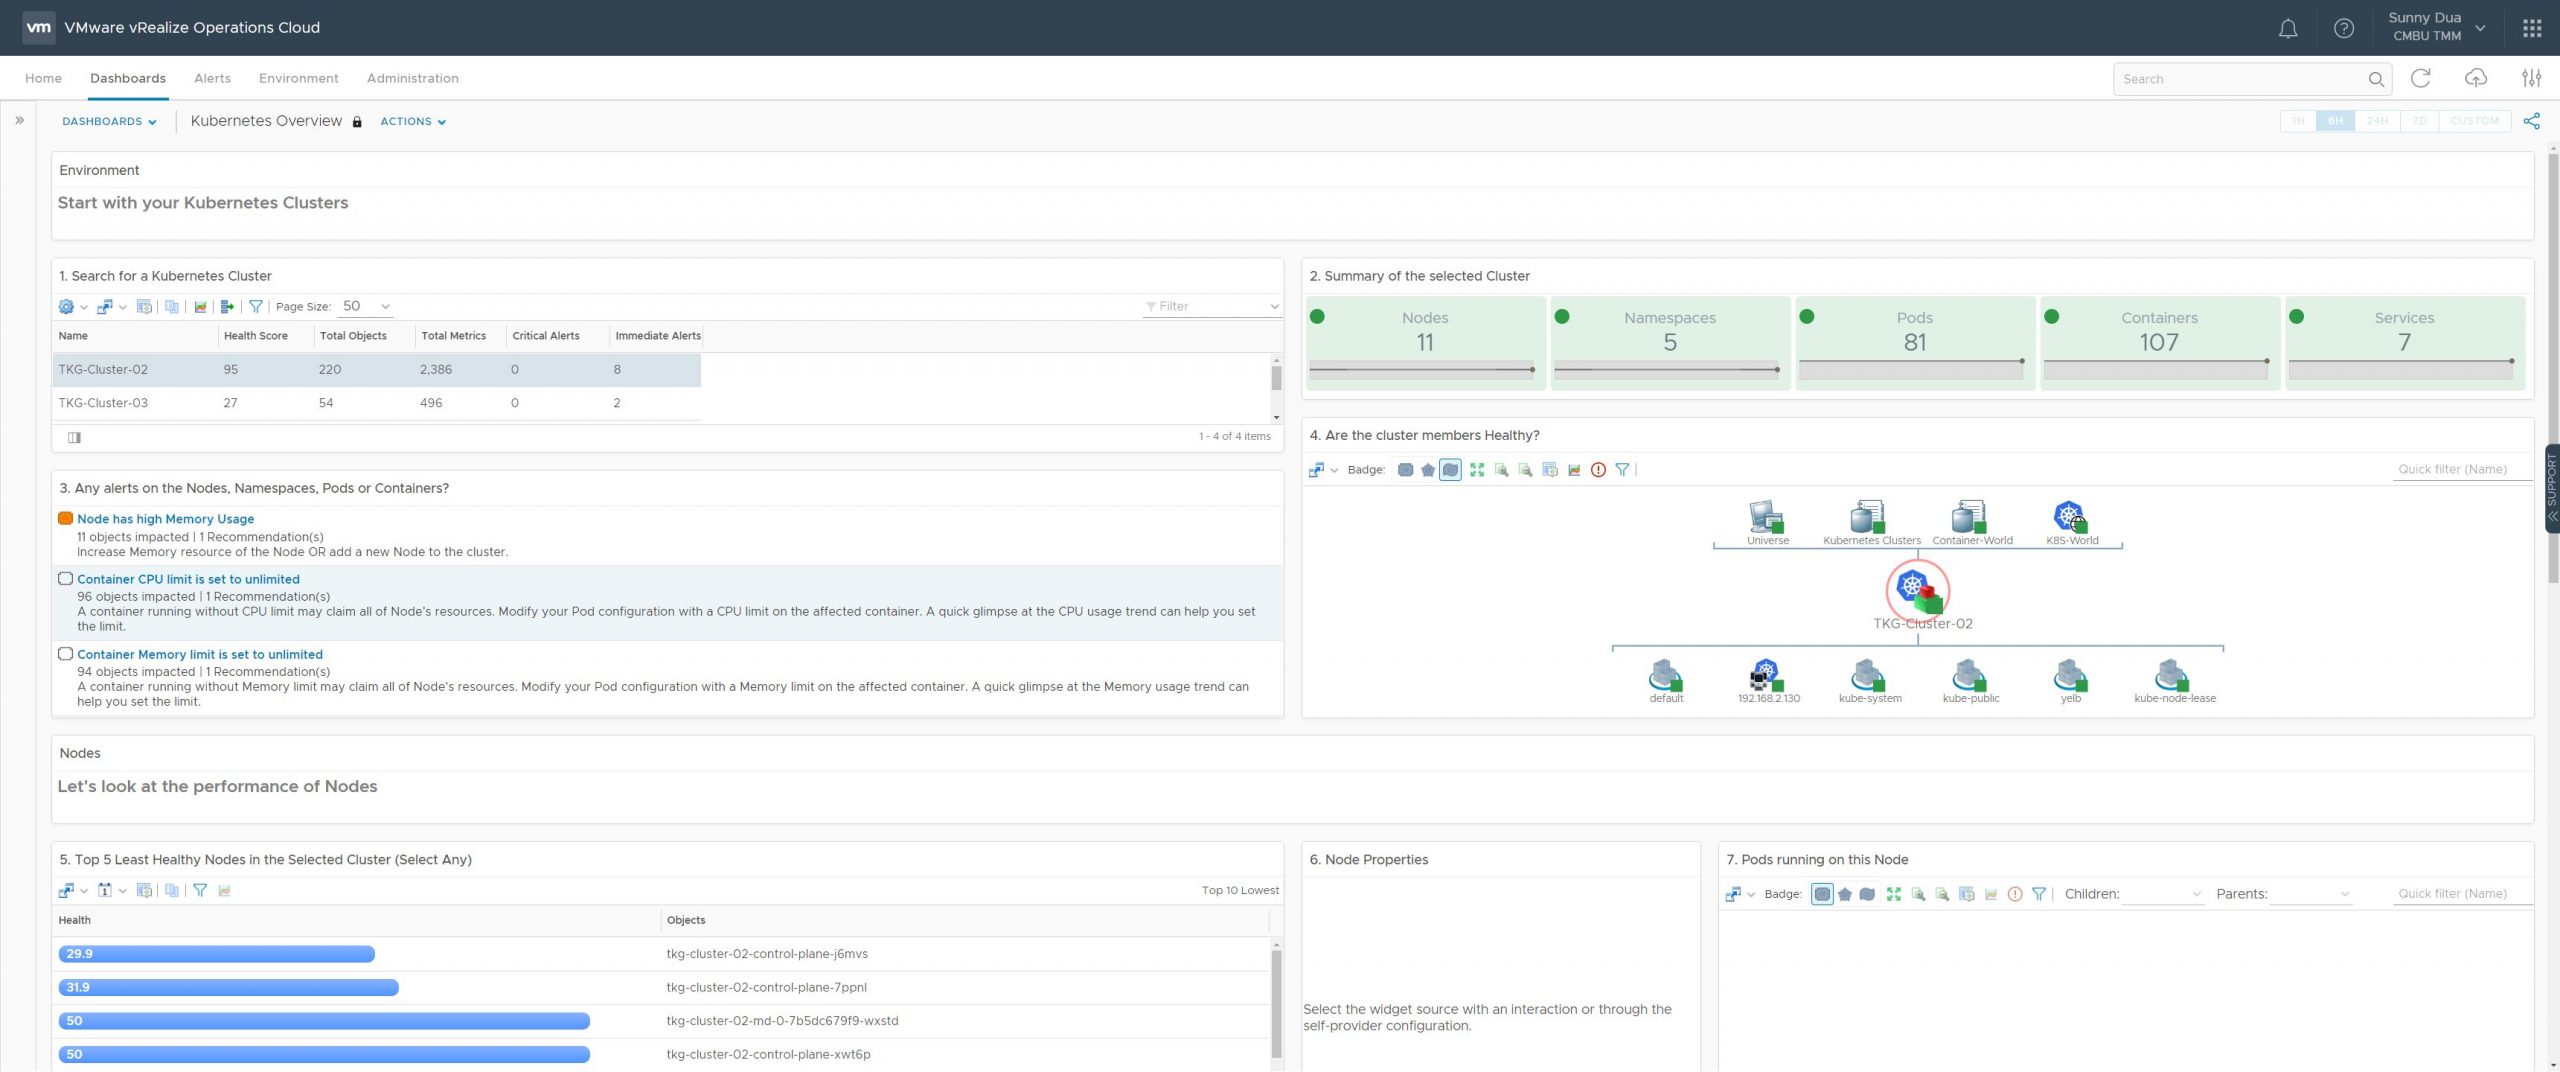
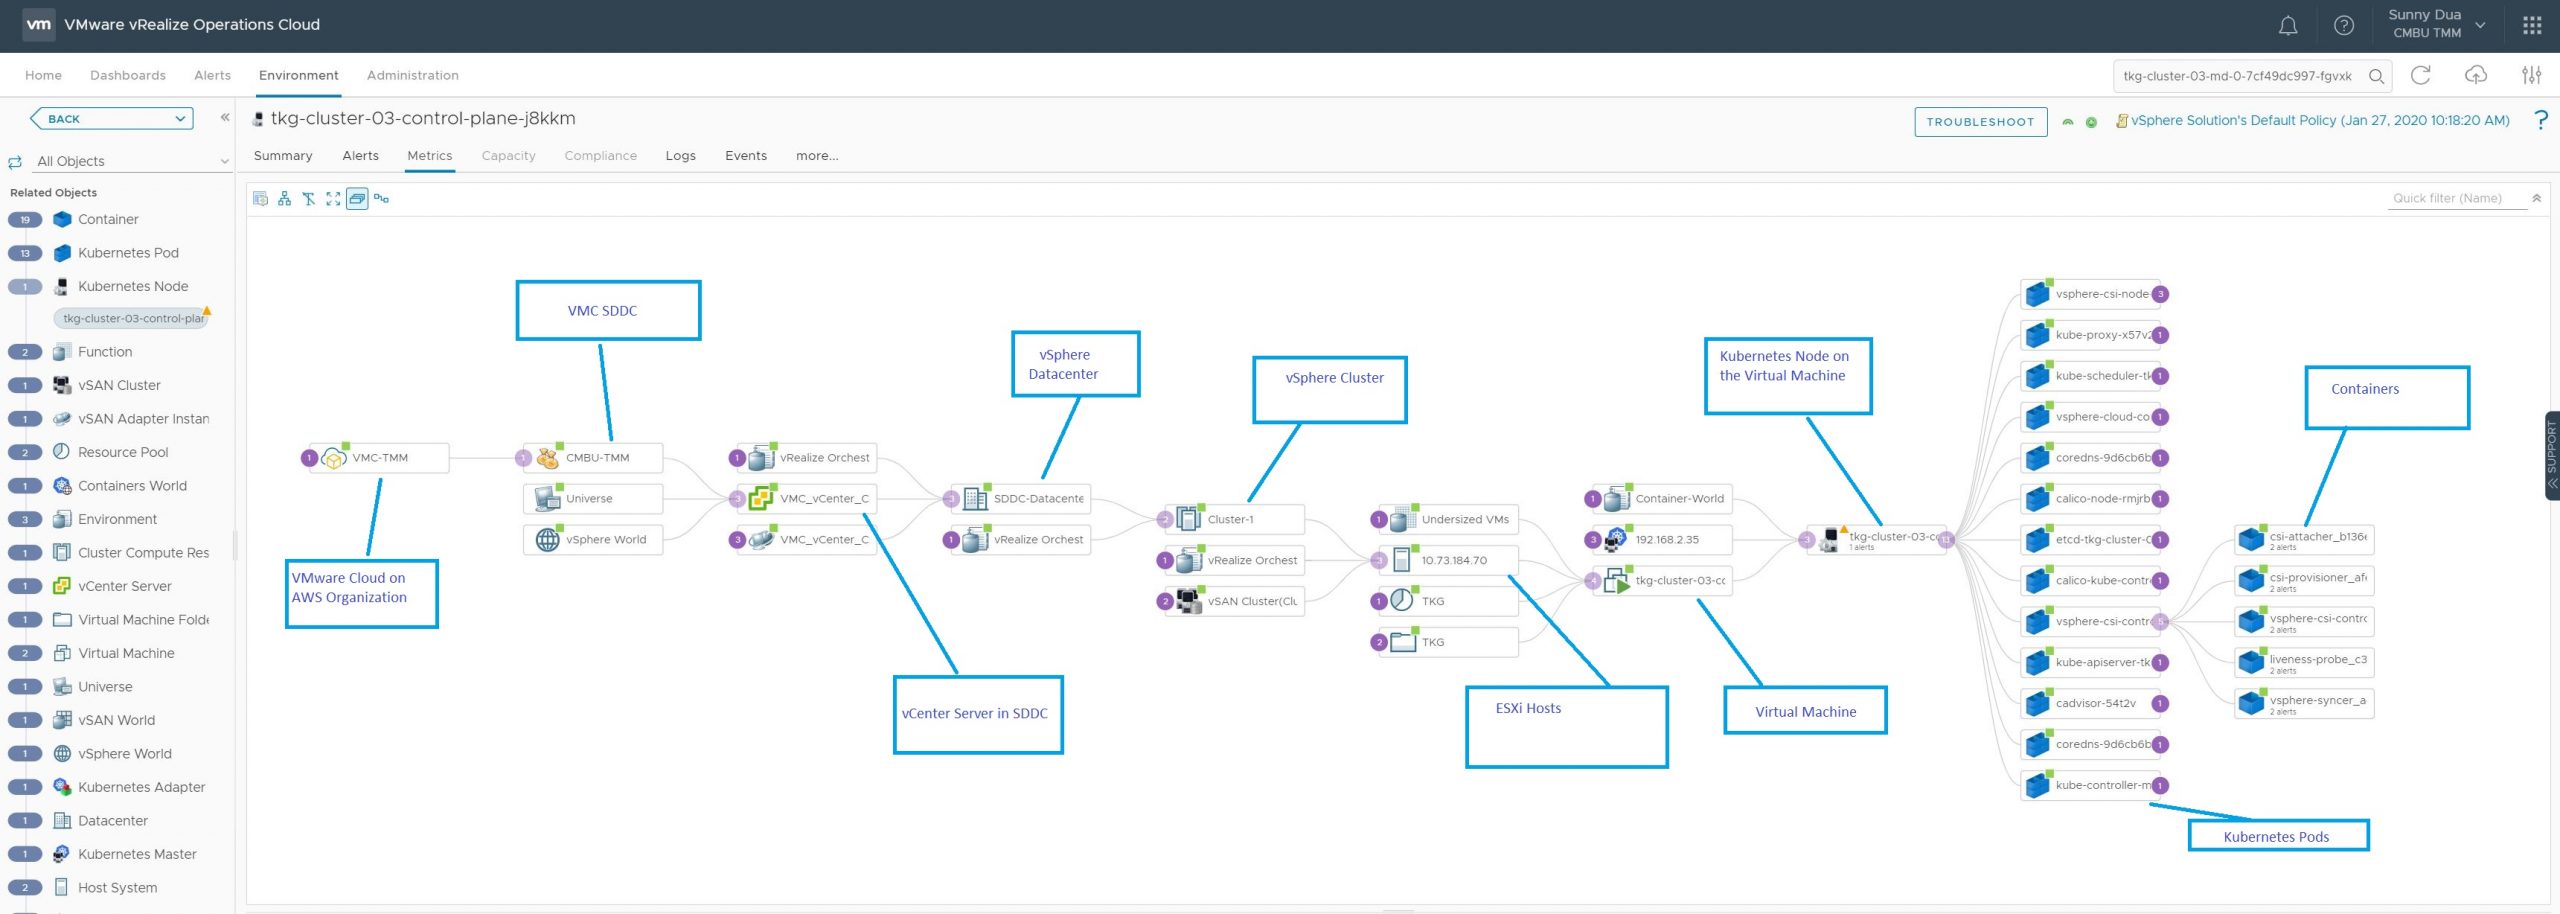
Since my Kubernetes cluster is running on a VMware Cloud AWS environment, let's see how that advanced setting creates the relation between the Kubernetes nodes and VMs. Select a node from Widget 5 and click on the Object Details icon from this dashboard.

From Object Details, click on the Metrics tab, and let's expand the related VM Kubernetes objects, here you can see the entire related inventory from a container, all the way to the VMC Org.
Here is another example of a Kubernetes application named "YELB", that I have deployed on my Kubernetes cluster. vRealize Operations automatically detects that and I can click on the Troubleshoot to start troubleshooting issues using the "Troubleshooting Workbench".
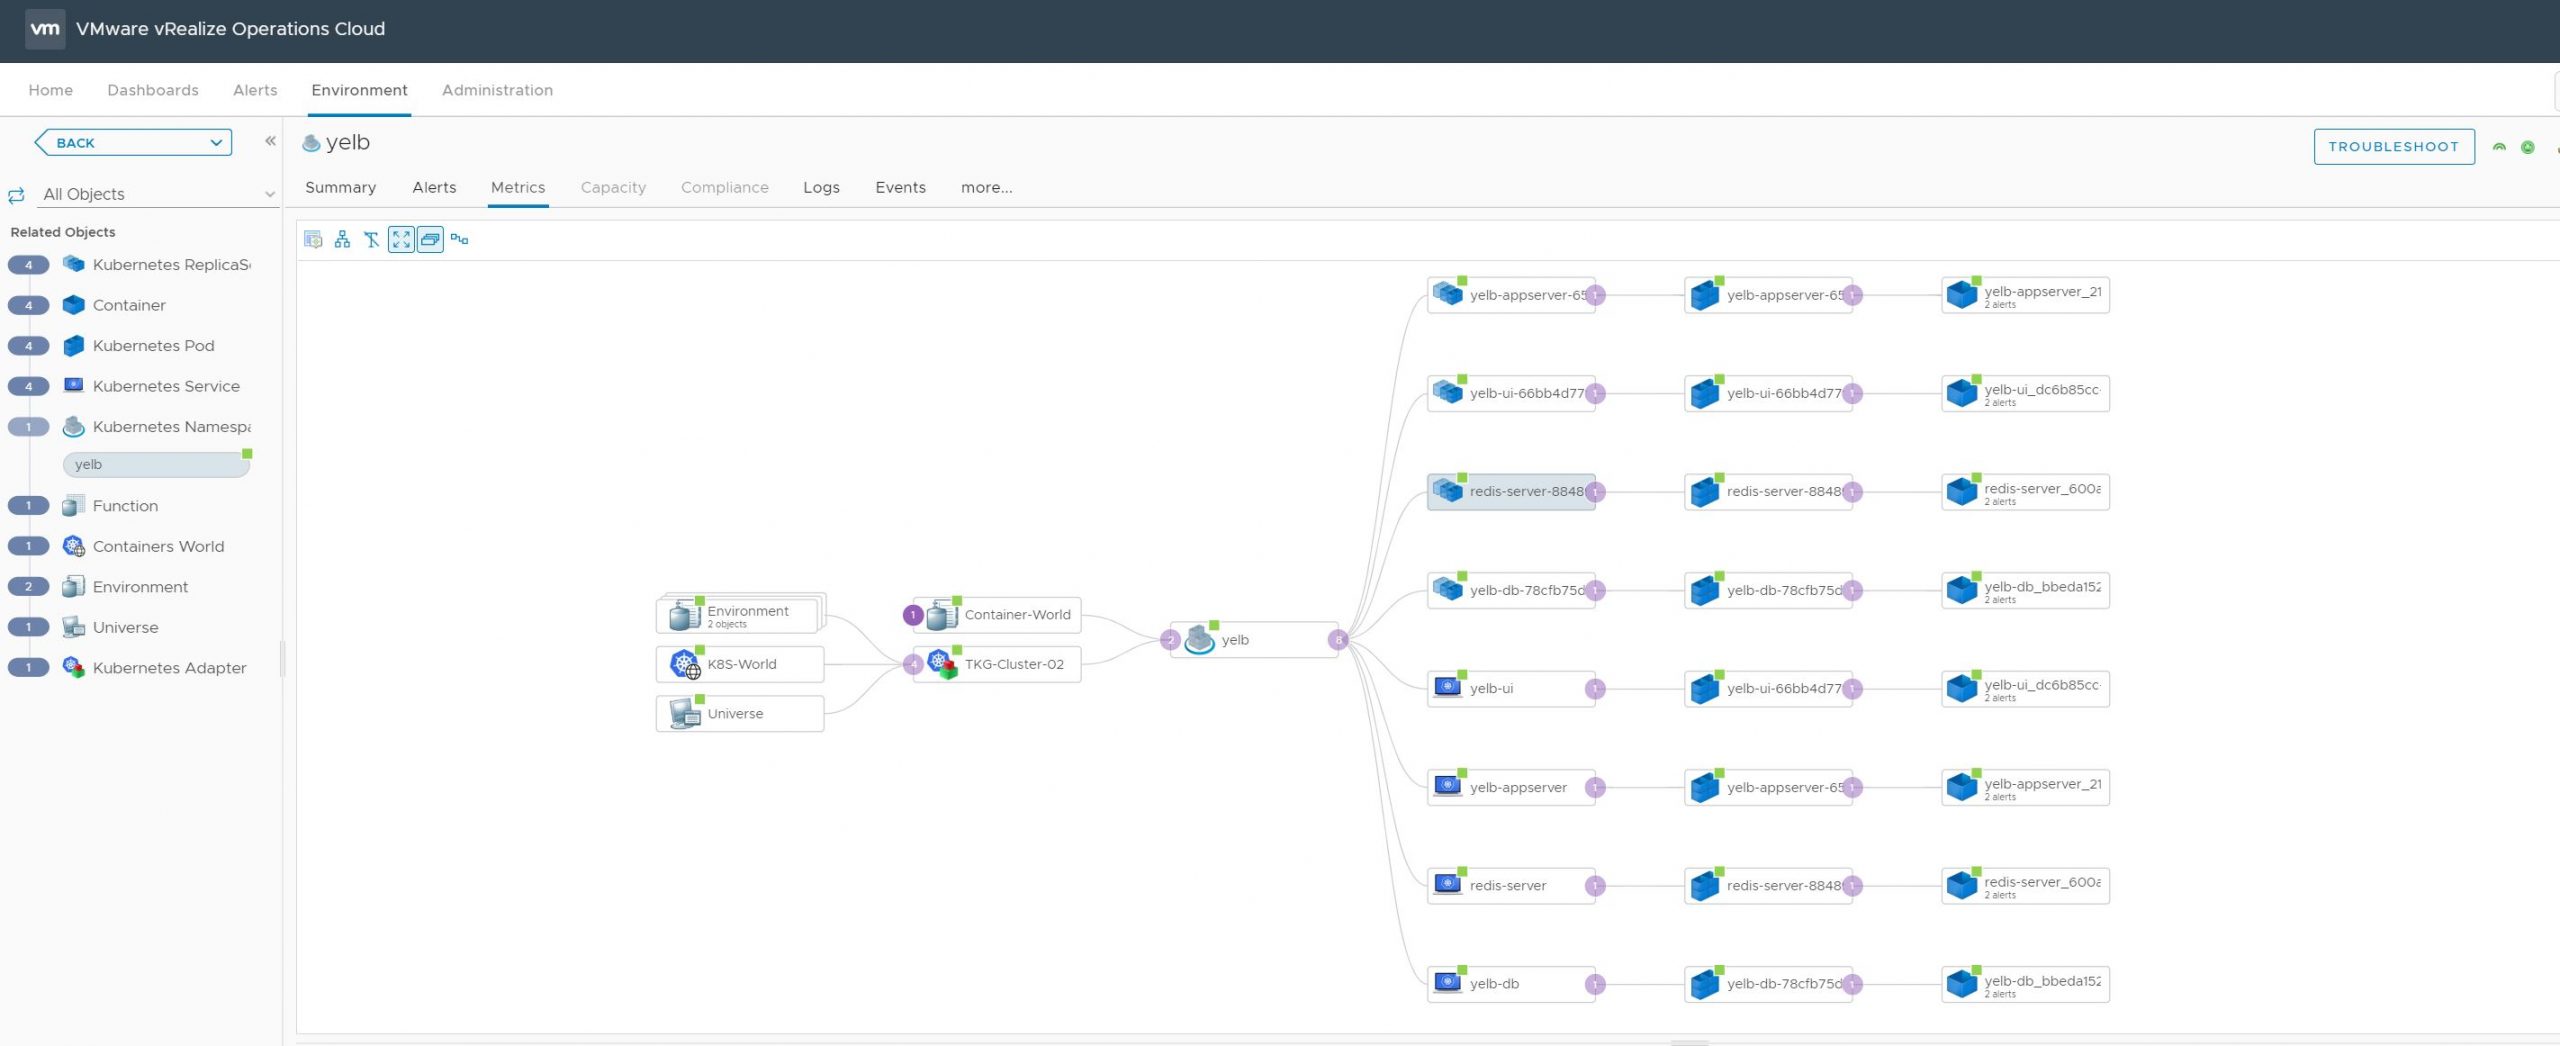
Yelb in Troubleshooting Workbench:

Conclusion
- The container management solution of vRealize Operations provides deep visibility into any flavor of Kubernetes running on top of vSphere. Be it Tanzu Kubernetes Grid, deployed Kubernetes clusters, or Openshift, it does not matter.
- When it comes to Container Operations for Central IT teams, full-stack visibility from applications to infrastructure is the need of the hour and with vRealize Operations and vRealize Operations Cloud, we provide this visibility by leveraging your existing investments in VMware.
- Lastly, if you are running Kubernetes clusters on a non-vSphere platform such as AWS, Azure, or GCP, you can still leverage the container solution to get visibility into upstream Kubernetes.

Hope this helps. Leave your comments here or reach out via twitter @sunny_dua for any follow-up conversations. Happy Kubernetting!!
No comments:
Post a Comment