This page is a repository of the all the vCenter Operations Manager and vRealize Operations Manager Dashboards. I will continue to add new dashboards to this page from myself and other community members. Feel free to use any of the dashboards in your environment and leave a comment below with your feedback:
****************************************************************************************************************************************
 Dashboard Name : NSX Load balancer Moniroting Dashboard
Author : Luciano Gomes
Short Description : This dashboard helps with monitoring NSX Load Balancer Services.
Version Supported : vROps 6.x, NSX Management Pack 3.x
Product Version : Advanced / Enterprise Edition
Installation Guide : http://virtual-red-dot.info/sample-dashboards-to-monitor-nsx-load-balancers/
****************************************************************************************************************************************
 Dashboard Name : Cluster Management Dashboard
Author : Scott Norris
Short Description : This dashboard provides the various key components of a vSphere Cluster in a Single Pane of Glass.
Version Supported : vROps 6.x
Product Version : Advanced / Enterprise Edition
Installation Guide : http://www.virtualiseme.net.au/index.php/vrops-cluster-dashboard-step-by-step-how-too/
****************************************************************************************************************************************
 Dashboard Name : Performance & Capacity Dashboard
Author : Sunny Dua
Short Description : A hybrid dashboard which would help you gauge the Capacity & Measure the performance of your virtual infrastructure from a single pane.
Version Supported : vROps 6.x
Product Version : Advanced / Enterprise Edition
Installation Guide : http://vxpresss.blogspot.sg/2015/11/creating-capacity-performance.html
****************************************************************************************************************************************
 Dashboard Name : Help Desk Dashboard
Author : Sunny Dua
Short Description : This dashboard can be ideally used by your level 1 team to quickly understand the infrastructure areas which could be a performance bottleneck for a virtual machine.
Version Supported : vROps 6.x
Product Version : Advanced / Enterprise Edition
Installation Guide : http://vxpresss.blogspot.sg/2015/10/using-help-desk-dashboard-to-simplify.html
****************************************************************************************************************************************
 Dashboard Name : VSAN Monitoring Dashboard
Author : Sunny Dua
Short Description : Monitor the key hardware components of VSAN by using this dashboard. This uses the VSAN management pack a.k.a. MPSD.
Version Supported : vROps 6.x, MPSD
Product Version : Advanced / Enterprise Edition
Installation Guide : http://vxpresss.blogspot.in/2015/09/monitoring-vsan-hardware-using-vrealize.html
****************************************************************************************************************************************
 Dashboard Name : Datastore Utilization Dashboard
Author : Sunny Dua
Short Description : Monitor the space utilization of your datastores and the virtual machines using the space on those datastores.
Version Supported : vROps 6.x
Product Version : Advanced / Enterprise Edition
Installation Guide : http://vxpresss.blogspot.in/2015/07/monitor-datastores-using-datastore.html
****************************************************************************************************************************************
 Dashboard Name : One Click Cluster Capacity Dashboard
Author : Sunny Dua
Short Description : Quickly see the key capacity of each of your ESXi Clusters by a click of a button.
Version Supported : vROps 6.0.x
Product Version : Advanced / Enterprise Edition
Installation Guide : http://vxpresss.blogspot.in/2015/04/the-return-of-one-click-cluster.html
****************************************************************************************************************************************
 Dashboard Name : Cricket World Cup Dashboard
Author : Sunny Dua
Product Version : Advanced / Enterprise Edition
Installation Guide : http://vxpresss.blogspot.in/2015/02/catching-up-with-world-cup-cricket-2015.html
****************************************************************************************************************************************
 Dashboard Name : Virtual Datacenter Capacity Dashboard
Author : Sunny Dua
Version Supported : vCOps 5.x
Product Version : Advanced / Enterprise Edition
Installation Guide : http://vxpresss.blogspot.in/2014/10/creating-one-click-datacenter-capacity.html
****************************************************************************************************************************************
 Dashboard Name : VDI Dashboard
Author : Sunny Dua
Product Version : Advanced / Enterprise Edition
Installation Guide : http://vxpresss.blogspot.in/2014/09/building-vdi-custom-dashboard-and.html
****************************************************************************************************************************************
 Dashboard Name : Cluster Utilization Dashboard
Author : Sunny Dua
Short Description : Gives you a single page view of the Utilization of all your vSphere Clusters being monitored by vCenter Operations Manager
Version Supported : vCOps 5.x
Product Version : Advanced / Enterprise Edition
Installation Guide : http://vxpresss.blogspot.in/2014/04/part-1-creating-cluster-utilization.html
****************************************************************************************************************************************
 Dashboard Name : One Click Cluster Capacity Dashboard
Author : Sunny Dua
Short Description : Quickly see the key capacity of each of your ESXi Clusters by a click of a button.
Version Supported : vCOps 5.x
Product Version : Advanced / Enterprise Edition
Installation Guide : http://vxpresss.blogspot.in/2014/03/part-1-creating-one-click-cluster.html
****************************************************************************************************************************************

Dashboard Name : Fault Metric Dashboard
Author : Sunny Dua
Short Description : This dashboard can be used to track faults with Virtual Machines, ESXi Hosts & Datastores along with the Key Metrics associated with those objects.
Version Supported : vCOps 5.x
Product Version : Advanced / Enterprise Edition
Installation Guide : http://vxpresss.blogspot.sg/2013/10/creating-vcenter-operations-manager.html
****************************************************************************************************************************************

Dashboard Name : Datastore Usage%
Author : Sunny Dua
Short Description : Provides a heatmap of all the datastores being monitored by vCenter Operations Manager. This will help you monitor the space remaining on the datastores in your virtual environment.
Version Supported : vCOps 5.x
Product Version : Advanced / Enterprise Edition
Installation Guide : http://vxpresss.blogspot.in/2013/05/part-1-using-vcops-super-metrics-custom.html
****************************************************************************************************************************************
NSX LOAD-BALANCER MONITORING DASHBOARD
***************************************************************************************************************************************

Author : Luciano Gomes
Short Description : This dashboard helps with monitoring NSX Load Balancer Services.
Version Supported : vROps 6.x, NSX Management Pack 3.x
Product Version : Advanced / Enterprise Edition
Installation Guide : http://virtual-red-dot.info/sample-dashboards-to-monitor-nsx-load-balancers/
****************************************************************************************************************************************
****************************************************************************************************************************************
CLUSTER MANAGEMENT DASHBOARD
***************************************************************************************************************************************

Author : Scott Norris
Short Description : This dashboard provides the various key components of a vSphere Cluster in a Single Pane of Glass.
Version Supported : vROps 6.x
Product Version : Advanced / Enterprise Edition
Installation Guide : http://www.virtualiseme.net.au/index.php/vrops-cluster-dashboard-step-by-step-how-too/
****************************************************************************************************************************************
****************************************************************************************************************************************
PERFORMANCE & CAPACITY DASHBOARD
***************************************************************************************************************************************

Author : Sunny Dua
Short Description : A hybrid dashboard which would help you gauge the Capacity & Measure the performance of your virtual infrastructure from a single pane.
Version Supported : vROps 6.x
Product Version : Advanced / Enterprise Edition
Installation Guide : http://vxpresss.blogspot.sg/2015/11/creating-capacity-performance.html
****************************************************************************************************************************************
****************************************************************************************************************************************
EXCESSIVE VM IOPS DASHBOARD
***************************************************************************************************************************************

Dashboard Name : Excessive VM IOPS Dashboard
Author : Iwan Rahabok
Short Description : With this dashboard, one can easily find a VM which is doing excessive amount of IOPS in your Virtual Infrastructure at any given point of time.
Version Supported : vROps 6.x
Product Version : Advanced / Enterprise Edition
Installation Guide : http://virtual-red-dot.info/follow-up-on-duncans-blog-on-indonesiancloud/
****************************************************************************************************************************************
****************************************************************************************************************************************
HELP-DESK DASHBOARD
***************************************************************************************************************************************

Author : Sunny Dua
Short Description : This dashboard can be ideally used by your level 1 team to quickly understand the infrastructure areas which could be a performance bottleneck for a virtual machine.
Version Supported : vROps 6.x
Product Version : Advanced / Enterprise Edition
Installation Guide : http://vxpresss.blogspot.sg/2015/10/using-help-desk-dashboard-to-simplify.html
****************************************************************************************************************************************
****************************************************************************************************************************************
VIRTUAL SAN HARDWARE MONITORING DASHBOARD
***************************************************************************************************************************************

Author : Sunny Dua
Short Description : Monitor the key hardware components of VSAN by using this dashboard. This uses the VSAN management pack a.k.a. MPSD.
Version Supported : vROps 6.x, MPSD
Product Version : Advanced / Enterprise Edition
Installation Guide : http://vxpresss.blogspot.in/2015/09/monitoring-vsan-hardware-using-vrealize.html
****************************************************************************************************************************************
****************************************************************************************************************************************
DATASTORE UTILIZATION DASHBOARD
***************************************************************************************************************************************
 Dashboard Name : Datastore Utilization Dashboard
Author : Sunny Dua
Short Description : Monitor the space utilization of your datastores and the virtual machines using the space on those datastores.
Version Supported : vROps 6.x
Product Version : Advanced / Enterprise Edition
Installation Guide : http://vxpresss.blogspot.in/2015/07/monitor-datastores-using-datastore.html
****************************************************************************************************************************************
****************************************************************************************************************************************
CLUSTER CAPACITY DASHBOARD
***************************************************************************************************************************************

Author : Sunny Dua
Short Description : Quickly see the key capacity of each of your ESXi Clusters by a click of a button.
Version Supported : vROps 6.0.x
Product Version : Advanced / Enterprise Edition
Installation Guide : http://vxpresss.blogspot.in/2015/04/the-return-of-one-click-cluster.html
****************************************************************************************************************************************
****************************************************************************************************************************************
CRICKET WORLD CUP DASHBOARD
***************************************************************************************************************************************

Author : Sunny Dua
Short Description : This dashboard is for having some fun with the dashboard feature of vCOps/vROps. You can build out a dashboard out of any webpage using this dashboard.
Version Supported : vCOps 5.x, vROps 6.xProduct Version : Advanced / Enterprise Edition
Installation Guide : http://vxpresss.blogspot.in/2015/02/catching-up-with-world-cup-cricket-2015.html
****************************************************************************************************************************************
****************************************************************************************************************************************
VIRTUAL DATA-CENTER CAPACITY DASHBOARD
***************************************************************************************************************************************

Author : Sunny Dua
Short Description : This dashboard helps you to look at capacity and performance metrics of your virtual datacenter. This provides you a holistic view of the environment.
Product Version : Advanced / Enterprise Edition
Installation Guide : http://vxpresss.blogspot.in/2014/10/creating-one-click-datacenter-capacity.html
****************************************************************************************************************************************
****************************************************************************************************************************************
VIRTUAL DESKTOP INFRASTRUCTURE DASHBOARD
***************************************************************************************************************************************
 Dashboard Name : VDI Dashboard
Author : Sunny Dua
Short Description : This one-click high-level dashboard gathers the most important metrics in a typical VDI environment. In the event of a production outage, this type of dashboard can be of monumental value.
Version Supported : vCOps 5.x, V4H AdapterProduct Version : Advanced / Enterprise Edition
Installation Guide : http://vxpresss.blogspot.in/2014/09/building-vdi-custom-dashboard-and.html
****************************************************************************************************************************************
****************************************************************************************************************************************
CLUSTER UTILIZATION DASHBOARD
***************************************************************************************************************************************

Author : Sunny Dua
Short Description : Gives you a single page view of the Utilization of all your vSphere Clusters being monitored by vCenter Operations Manager
Version Supported : vCOps 5.x
Product Version : Advanced / Enterprise Edition
Installation Guide : http://vxpresss.blogspot.in/2014/04/part-1-creating-cluster-utilization.html
****************************************************************************************************************************************
****************************************************************************************************************************************
ONE CLICK CLUSTER CAPACITY DASHBOARD
***************************************************************************************************************************************
 Dashboard Name : One Click Cluster Capacity Dashboard
Author : Sunny Dua
Short Description : Quickly see the key capacity of each of your ESXi Clusters by a click of a button.
Version Supported : vCOps 5.x
Product Version : Advanced / Enterprise Edition
Installation Guide : http://vxpresss.blogspot.in/2014/03/part-1-creating-one-click-cluster.html
****************************************************************************************************************************************
****************************************************************************************************************************************
FAULT METRIC DASHBOARD
***************************************************************************************************************************************
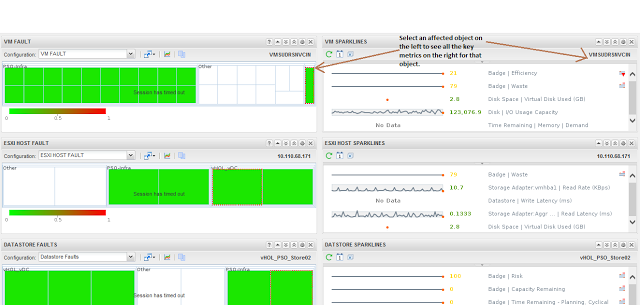
Dashboard Name : Fault Metric Dashboard
Author : Sunny Dua
Short Description : This dashboard can be used to track faults with Virtual Machines, ESXi Hosts & Datastores along with the Key Metrics associated with those objects.
Version Supported : vCOps 5.x
Product Version : Advanced / Enterprise Edition
Installation Guide : http://vxpresss.blogspot.sg/2013/10/creating-vcenter-operations-manager.html
****************************************************************************************************************************************
****************************************************************************************************************************************
DATASTORE USAGE DASHBOARD
***************************************************************************************************************************************

Dashboard Name : Datastore Usage%
Author : Sunny Dua
Short Description : Provides a heatmap of all the datastores being monitored by vCenter Operations Manager. This will help you monitor the space remaining on the datastores in your virtual environment.
Version Supported : vCOps 5.x
Product Version : Advanced / Enterprise Edition
Installation Guide : http://vxpresss.blogspot.in/2013/05/part-1-using-vcops-super-metrics-custom.html
****************************************************************************************************************************************


