Showing posts with label vRealize Operations Manager. Show all posts

Tuesday, September 26, 2017

vROps Webinar 2017 - Part 4 - Optimizing Workload Performance Using Automation

While we all know that, automating day to day operations tasks is becoming the choice of an IT organization, it is hard for them to find a solution which can completely understand their business policies and provide them the efficiency they need from automating simple operational tasks.


Based on our research, we found that, one of the most time consuming activity done by an Virtual Infrastructure Administrator is to juggle resources between the changing business requirements and ensure that every VM which is being hosted in their environment is BEING SERVED WELL.
With VMware vRealize Operations 6.6, a new and innovative solution is introduced to cater to this use case. While there are other products in the market which claim to have done this, what we have learned from our customers that Technology applied by those solutions quickly forgets that Automation should also consider business policies. This functionality is called Workload Balance. In our last episode of the webinar series, we discussed and demo'ed this capability.

Here is the recording:


We would highly appreciate if you could spend 30 seconds to fill up this quick and simple survey to provide us your feedback. You can also request topics of your choice through this survey.

Thursday, July 27, 2017

vROps Webinar Series 2017 - Part 3 - What's New with vROps 6.6.

Hello!!! Hope you enjoyed the last episode of vRealize Operations Webinar Series.This time around we spoke about the all new version of the product : vRealize Operations Manager 6.6, which is recently released by VMware.

We started with an overview of all the cool new stuff and then drill down into individual areas. We then jumped into a Live Demo as usual to see the new features in action.

We would highly appreciate if you could spend 30 seconds to fill up this quick and simple survey to provide us your feedback. You can also request topics of your choice through this survey.


Here is the recording!


Note : It is recommended that you watch the video in HD quality for a great experience.

Share & Spread the Knowledge!!

Thursday, July 13, 2017

New Contest : Share Your vROps 6.6 Upgrade Story & Win Exciting Prizes

The VMware Communities just started a contest on vRealize Operations Manager 6.6. Make sure you check it out and participate by sharing your experience with vRops 6.6.


If you are all excited about our new release of vRealize Operations 6.6 and have already upgraded, please share your story. We are running a contest through July 2017 to spotlight the top 3 stories in our upcoming blog. The top 3 winners will be selected to have a 1:1 training workshop for your entire team with our product experts.


Top 5 reasons to upgrade to vROps 6.6:
  1. Simple process and more efficient
  2. Fully automated workload balancing
  3. More Dashboards Out of the Box
  4. Tighter Integration with VSAN, vRealize Log Insight, vRealize Business for Cloud
  5. Better look and feel with HTML5 Clarity UI

Please post your success story in the VMware Communities forum with the answe to the following 3 simple questions:

  • Why you upgraded to vRealize Operations 6.6?
  • What benefits have you experienced from this upgrade?
  • Can you share best practices with your peers?
>> Judge Criteria: Most interesting best practices, upgrade themes into any of the 5 categories above.

>> Watch these videos to get the most out of vROps 6.6


Look forward to exciting stories! Go vRops Ninja!!
vROps_Ninja.png

Tuesday, June 13, 2017

Part 1 - What's New with vRealize Operations Manager 6.6.

I am happy to share that VMware has released the vRealize Operations Manager 6.6 version which was anounced through a blog post by Taruna Gandhi a few days back.

While I have been closely following all the releases of vROps for the past couple of years, this release is special to me as I am a part of the engineering group which has worked on making this release possible for the last 6 months.

The goal behind vRealize Operations Manager 6.6 was to improve the time to value and accelerate the user experience by providing out of the box answers to questions which are faced by IT on a day to day basis. Be it the administrators who manage the IT systems and applications, or the Executives, who are responsible for making strategic decisions around Capacity and Growth, this release of vROps caters to all the personas will multiple use cases out of the box.

In my opinion, operations at all levels and across all the areas of IT is ran in two modes. The preferred choice is Proactive, however many times one has to be Reactive as well. Be it Performance, Capacity, Utilization, Availability, Configuration or Compliance, one must have easy ways to answer simple questions while running operations.


For instance, a person responsible for procuring capacity should have simple yet exhaustive statistics which allow them to take the next procurement decision proactively. A System Administrator should have simple yet comprehensive metrics and logs to troubleshoot an issue in a fire-fighting situation. 

If you notice, the requirements above are conflicting and it is always important to strike a balance between TOO SIMPLE and TOO COMPLEX. You sway either ways and the value is lost.

With the above thought process in mind, vROps 6.6 was designed and I am happy to give you a quick preview of What's New with this release!!

Note, this is just the first part, in the coming days, you will see a series of blog posts which will deep dive into individual areas to help you use all the goodness coming with this release. With that, let's dissect the release notes to see what all is coming in:


  • Simplified usability and faster time to value capabilities:
    • New HTML5 user interface provides an easier and consistent experience. The new UI is clarity based which is a standard used by all the products of VMware. This allows you to seamlessly go from one area of the solution to another whether it is metrics, logs or cost without learning the menus or impacting your user experience.
    • Consolidation and simpler grouping of menus leading to enhanced user experience.
    • The Getting Started dashboard allows for quick navigation.
    • Persona based dashboards provides for answers in one place. Dashboards are separated into categories such as Operations, Capacity and Utilization, Performance Troubleshooting, Workload Balance, and Configuration and Compliance.
    • Out of the box integration with vSAN and vRealize Automation provides quick time to value. 

  • Added Native vSAN management capabilities:
    • Allows for centralized management across stretched clusters.
    • Ability for complete vSAN management, which includes administering performance, capacity, logs, and configuration and health.

  • Fully Automated Workload Balancing:
    • Ensures performance across the datacenter's with fully automated workload balancing, across clusters and across data stores.
    • Ensures DRS Configurations and provides the option to set DRS automation level for individual objects.
    • Predictive DRS takes action to preempt resource contention.
    • Utilizes operations analytics to optimize initial placement of workloads through vRealize Automation.
  • Additional out-of-the-box compliance capabilities:
    • Ability to tackle compliance problems through the new vSphere hardening dashboard
    • Extends compliance through PCI & HIPAA compliance for vSphere.
    • Ensures business configurations through new cluster, host, and VM configuration dashboards.

    • Sizing & Scalability Enhancements:
      • You can now scale to 6 Extra Large Nodes in a cluster which can support up to 180,000 Objects and 45,000,000 metrics.
      • You can now monitor up to 60 vCenter Servers with a single instance of vROps.
      • A large Remote Collector can support up to 15000 objects.
      • and many more.....
    In the upcoming parts of this series, I will deep dive into each of the above mentioned areas and give you more details on how you can operationalize some of these features to match your day to day operational use cases.


    Stay tuned for more!!


    Thursday, March 2, 2017

    vRealize Operations Manager 6.5 is out. Operationalize with Confidence!

    VMware just announced the release of vRealize Operations Manager 6.5. With its cadence of delivering a new version every few months with valuable features, VMware allows customers to quickly use the tool as a means to ease out operations of the Software Defined Datacenter. 

    We all know that operations is not easy. It is as complex as human brain. Every individual dealing with day to day operations has different views on how they want to present and interpret data. While some are big fans of vROps Dashboards, others believe in the approach of notifications which can alarm them on predictive and actual failures in the software defined datacenter. I use the term SDDC, because I believe the architecture supports both on-premise and off-premise environments. In other words, while your SOPs could differ in operating Private & Public clouds, the operations framework moreover remains the same. Yes, you might be dealing with a complete different set of objects and metrics when you are running on Amazon, however the generic human behavior towards operating SDDC remains unchanged.

    While, I should be sitting with the AWESOME developers of the product and the Product Managers to celebrate this release, I am here in India working with a customer along with my buddy Iwan "e1" Rahabok to operationalize their Software Defined Datacenter. I am not complaining though, since I get to learn the most when I get requirements from a customer and we get into a heated discussion around operations management. The outcomes can be quite satisfying at the end of the day!!

    So without further a do lets see what this release has to offer:


    What's New?

    vRealize Operations Manager 6.5 focuses on enhancing product scalability limits and troubleshooting capabilities.
    • Additional monitoring capabilities
      • Adds ability to increase memory and increase the scope of monitoring within the same environment.
      • Enables you to monitor larger environments with the same footprint through platform optimization.
      • XL size node enables you to monitor more objects and it processes more metrics.

    • Automatic upgrade of Endpoint Operations Agents:
      • The new Endpoint Operations Agent upgrade bundle allows you to automatically upgrade the agent through the vRealize Operations Manager user interface.

    • Enhanced troubleshooting capabilities:
      • Quickly correlates logs and metrics in context for any monitored object using Log Insight within vRealize Operations Manager.
      • Creates custom metric groups that enables you to focus on most relevant metrics

    • Improved collaboration:
      • Simplifies export and import of custom groups and eases dashboard sharing between different vRealize Operations Manager installations.
      • Understands Private Cloud costs and Public Cloud spends by accessing vRealize Business for Cloud from within vRealize Operations Manager.

    General improvements
    • Removes scale limitations from Predictive DRS (pDRS).Predictive DRS enables vRealize Operations to provide long-term forecast metrics to augment the short-term placement criteria of the vSphere Distributed Resource Scheduler (DRS).

    • Default values for the following global settings have changed:
      • For Deleted Objects, it has changed from 360 hours to 168 hours
      • For Action History, it has changed from from 90 days to 30 days
      • For Symptoms/Alerts, it has changed from 90 days to 45 days
      These default settings are effective only for new vRealize Operations 6.5 installations.

    • Allows you to disable coloring in scoreboard widget.

    • The update process has been optimized. The update process might be up to 40% faster, depending on the size of the environment and the number of objects being monitored.


    Here are some useful links to get you going:


    Friday, October 28, 2016

    vROps Webinar Series 2016 - Part 10 - A Deep Dive into vROps API

    Time to publish the recording for the 10th episode of vROps Webinar Series. This time around we spoke about vRealize Operations Manager Resful API and how to use it. Post 20 minutes of slide-ware, I jumped into the lab and thanks to the demo god, we demonstrated a number of use cases and browsed through the documentation to make it easier for you to consume and use the same.


    So without further ado, here is the recording for this session:


    Note : It is recommended that you watch the video in HD quality for a great experience.

    Friday, October 21, 2016

    vROps Webinar 2016 - Announcing Part 10 : A Deep Dive into vROps API


    The month has been extremely busy but we still want to continue with the momentum of webinar series getting to the business end of the year. This time around we will talk about vRealize Operations Manager API. API is your friend if you are trying to automate things which you would normally do on GUI. While GUI is a favorite of most, the geeks prefer the API since that helps them to programatically initiate tasks and go out for a coffee. By the time they are back from the LONG coffee break, the work is done :-)

    This session would help you understand the API framework of vROps and as always we would jump into the lab to run a couple of scenarios which we would want to access through API and Geek Out!!


    So without further a do, save the date in your calendars and join use for the next episode of vRealize Operations Webinar Series 2016.

    Day & Date          : Friday, 28th October 2016

    Time                     : 1:30 PM - 2:30 PM  (SGT)

    Event                    : vROps Webinar 2016

    Topic                     : Part 10 : A Deep Dive into vROps API

    Speakers               : Simon Eady / Sunny Dua

    WebEx Link          : Join WebEx Meeting


    NOTE - Don't forget to mark your calendars by saving the Date!! Feel free to forward the invite to anyone who might be interested. It's open to all!!


    Sharing & Spread the Knowledge!!


    Monday, October 17, 2016

    Did You Know #5:Customizing Summary Pages on vRealize Operations Manager!

    With this article of the Did You Know series, I wanted to share a GEM of a feature using which can enhance your user experience and user interface of vRealize Operations Manager. If you have used vRealize Operations Manager, you will notice that the product has summary pages for each object type. For instance if you are on vSphere World Object, you would see a Summary Page which looks like this:


    In-fact, if you click on any other object types such as vCenter, Datacenter, Clusters, Hosts etc. you would see a similar summary page showing the Health, Risk & Efficiency of the Object Type which you have selected. The Health, Risk & Efficiency badges on this page are colored based on the Alerts triggered on the Object type which you have selected on the navigation pane in the left.

    While this view is useful to summarize the alert status, this might not be the default page which you want to see when you select an object type. If that is the case, vRealize Operations Manager provides you the option to change this default summary page to the dashboard of your choice (I have seen this feature on vROps 6.2 and 6.3). In my opinion this is a super cool feature as now yo can create your own summary pages using vROps Custom Dashboards and then use them as default summary pages (only applicable to license editions where you can create custom dashboards)

    Here is how you do it:

    Create a custom dashboard for the object type which you want to chose as the summary page beforehand.

    1- Login to vRealize Operations Manager using Administrative Privileges. (preferably admin account).

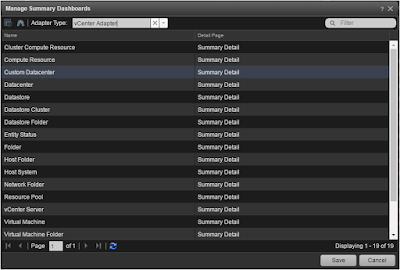
    2- Click on Content -> Dashboards -> Blue Wheel Icon -> Manage Summary Dashboards


    3- Click on the drop-down to select the Adapter Type under which you want to select an Object Type for which you want to change the summary page.


    4- In my case I want to change the Home Page for the vSphere World and hence I will select the vCenter Adapter, which will list all the object types under that adapter.


    5- We will select the vSphere World from this list and click on the gauge shaped icon to Assign a Dashboard for this Object Type.


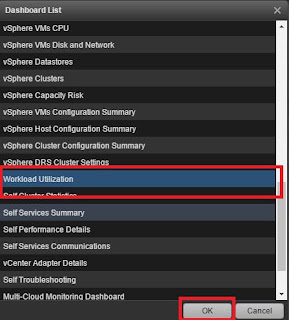
    6- Once I click on that icon, I will get a list of all the dashboards I have in my vROps instance. I will go ahead and select the dashboard which I wish to chose, in this case I will select the Workload Utilization dashboard and click on OK to save the changes.


    6- Let's go back to vSphere World and see how the summary page looks like after this change. Click on Environment -> vSphere Hosts and Clusters -> vSphere World.

    You can now see a completely different home page than what you usually see. 


    This will help you enhance your instances of vROps with you self customized dashboards and help you jazz up your deployment with personalized views at each object level..

    Hope this helps with day to day data-center operations using vRealize Operations Manager.


    Stay tuned for more goodies!!


    Thursday, October 13, 2016

    Did You Know #4 - Restricting Virtual Machine Collection on vROps!!

    Welcome back to the part 4 of the did you know series on vRealize Operations Manager. This series is all about small nuggets on vRealize Operations Manager, which can help you with day to day IT operations in your Software Defined Datacenter.

    With this article, I wanted to make you aware of a setting which allows you to filter out virtual machine objects from collection in vRealize Operations Manager. While this was always possible by using a collection user with limited rights on objects in vCenter, this feature is natively available with vROps 6.1 and beyond.

    With this option, you can limit the number of virtual machines from collection on a vCenter Adapter. In my case, I used this option to disable collection of Virtual Machine Object completely. This would mean that I would only collect data from the remaining objects which is vCenter Server Object, Datacenter Object, ESXi Hosts, Datastores etc. So basically everything except the VM objects. The use cases for this deployment model are following:-

    I- Infrastructure Monitoring - In this case the IAAS provider just wants to leverage vROps for monitoring the underlying infrastructure and have no responsibility of monitoring the VMs

    II- Centralized Dash-boarding & Reporting for large scale deployment - Another use case is to have a centralized vROps with reporting and dash-boarding capabilities, especially large scale deployments. In cases where an organization has multiple sites across the globe, they might not want a centralized vROps instance to avoid traffic flowing across the globe. While they would want to monitor individual sites with a full fledged vROps deployment, they might want to collect infrastructure level data into a centralized vROps for reporting purposes.

    Please Note: It is recommended that you DO NOT disable VM Object collection without understanding the full impact of this change. While this will give you scalability, it will not bring VM Data which might be used for calculating metrics at Host or Cluster level. Please use this only for specific uses cases and preferably in a development environment to understand the full impact, before rolling out in production.

    I am sure there would be other uses cases which could be solved with this feature. Here is where you can set it up:

    In case of an EXISTING deployment:

    1- Login to vROps with administrative privileges (preferably admin account) 

    2- Click on Administration -> Solutions

    3- Click on the VMware vSphere 

    4- Select the Adapter Instance where you want to change under the "VMware vSphere Solution Details" and click on the wheel shaped Configure Icon.

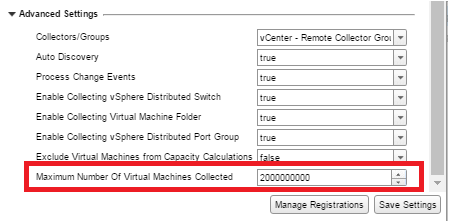
    5- Expand the advanced settings of the adapter. Here you will see an option of "Maximum Number of Virtual Machines Collected"  with a default value of "2000000000". This is the virtual machine count you can collect with this adapter instance.

    6- To disable VM collection completely, change this value to "0" (ZERO)


    7- Click on Save Settings to save the new setting.


    In case of a NEW deployment:

    The steps to be followed in case of a new deployment will be exactly the same. You would define this number at the time of configuring the adapter instance for the first time.


    Hope this helps with day to day data-center operations using vRealize Operations Manager.


    Stay tuned for more goodies!


    Monday, October 10, 2016

    Did You Know #3 - Using Wait Cycles for Time Based Alerts in vROps!


    In this part of the "Did You Know" series, I will provide you a tip, using which you can create time based alerts in vROps. I am happy to share that this was an output of a brainstorming session with a customer and at the end of the discussion the customer himself proposed this solution and I was immediately testing the idea in my lab with successful results.

    The use case for the time based alert in our situation was to create an alert which would trigger if a virtual machine is running on a snapshot for more than 24 hours and if the snapshot space on that virtual machine is more than 0 GB.

    The challenge with this requirement is around the time factor. Different workloads can have different impact of running on snapshots. For instance a web server running on a snapshot might not be impacted much from a performance standpoint, however an Oracle database VM running on a virtual disk snapshot would definitely not be a happy camper at the time it's running database transactions. Just to be clear, we are discussing vSphere snapshots here and not any other snapshot technologies. With vROps, there is no metric today which tracks the snapshot on the basis of time. While there are metrics which define the age of the snapshot, using these metrics for alerts become impossible, as for each snapshot a new directory is created, under which a snapshot drive is created and it increments in size. As soon as you delete this snapshot and take a new one on vCenter, vROps creates a new directory for this new snapshot and hence it is difficult to track hundreds of directories which keep changing, specially in an environment where snapshots are heavily used.

    In order to overcome this situation, we will create a new alert. If you are new to Alerts in vROps, I would highly recommend that you watch this episode of my yearly long Webinar Series to get well equipped about vROps Alerts and Symptoms.

    We will start by creating a new symptom & an alert definition:


    1- Login to vROps with credentials having rights to create new Alerts/Symptoms (admin credential would be nice).

    2- Click on Content -> Symptom Definitions. You will be under the metric/property symptom definitions category by default.

    3- Click on the sign to add a new Symptom.

    4- Here is how you will define the new symptom. Refer to the screenshot for more details:

    • Base Object Type : Virtual Machine
    • Metric Name : Disk Space|Snapshot|Virtual Machine Used (GB)


    5- Double click on this metric to add it to the right pane where we will describe this symptom.

    6- Here is how will you provide the details:

    • Static Threshold
    • Symptom Definition Name : Virtual Machine is running on a snapshot for more than 24 hours
    • Critical
    • Condition : When Metric is > 0 (This is the size of the snapshot)
    • Advanced : Wait Cycle - 288 (Each cycle is 5 minutes, hence the total minutes we will check for this condition is 1440 minutes which is 24 hours)
    • Advanced : Cancel Cycle - 1 (Once the condition is false, the alert will be cancelled in 5 minutes)


    7-  Click on Save to save this symptom. Once done we will create a new alert using this symptom.

    8- Click on Content -> Alert Definitions. Click on the sign to add a new Alert and provide the following details:

    "1. Name & Description"

    Name - Virtual Machine is running on a snapshot for more than 24 hours
    Description - This alert will trigger when a virtual machine is running on a snapshot for more than 24 hours.


    "2. Base Object Type"

    Virtual Machine


    "3. Alert Impact"


    "4. Add Symptom Definitions"

    Symptom Name : Virtual Machine is running on a snapshot for more than 24 hours


    "5. Add Recommendations"

    Add any recommendations from the available list or create your own.

    9- Click on Save. This will create a new alert definition and this alert will be enabled on the default policy by default.


    Please note that the Wait Cycle will start counting as soon as you create this alert definition, hence this alert will take atleast 24 hours to trigger. If you have VMs with snapshots (more than 24 hours old) in your environment, don't expect the alert to trigger immediately. The countdown to 24 hours will begin when you enable the alert in the policy.

    You can see that we used a Time Based symptom to solve a key problem which emerges and could lead to a number of issues in a virtual environment. Hope this will give you ideas on  how you can create more time based alerts using metric based symptoms.

    Hope this helps with day to day datacenter operations using vRealize Operations Manager.


    Stay tuned for more goodies!


    Wednesday, October 5, 2016

    Did You Know #2 - Leveraging vROps Remote Collectors for Local Adapters!

    In this part of the "Did You Know" series, I will talk about a small architectural tip which will not only help you enhance the performance of your vRealize Operations Manager cluster, it will also save you from up-sizing the cluster from let's say, medium to large nodes and at the end of the day save a ton of CPU & Memory in the process.

    Did you know that vRealize Operations Manager uses Remote Collectors for collecting data from a Remote Datacenter and send it over to the centralized vROps cluster. The diagram below shows the actual purpose for which a remote collector was introduced in vRealize Operations Manager:


    In the above example, we have a vROps Cluster in Site A. This cluster consists of 2 or more nodes which have a local collector module on them. This collector module collects the data from the local data sources, which are also known as adapter instances. Some examples of an adapter instances would be vCenter Adapter, NSX Adapter, MPSD (management pack for Storage Devices) etc.

    The Nodes of the cluster here have multiple roles to play. They not only collect the data from the data sources, they also have to crunch this data using the analytics engine, calculate dynamic thresholds, run the capacity engine and host all the data through the CASA and Web UI. 

    On the other hand in Site B, we have a remote collector group with 2 or more remote collectors (in a HA mode). Their role is to collect the data from the Site B data sources using the Collector framework on each node and send that data over to the centralized cluster in Site A. The Remote Collectors are small form factor of the vROps appliances which are stateless and the only role thy have is to collect data. Here are a few facts which make them great for playing the role of a collector from a sizing standpoint.

    The come in 2 form factors ***: 

    SMALL: 2 vCPU / 4 GB RAM. A small RC can collect 1500 Objects (an object can be a VM, Datastore, ESXi Host, LUN, etc) and upto 600,000 metrics. (1 VM usually creates around 250 metrics).

    LARGE: 4 vCPU / 16 GB RAM. A small RC can collect 12000 Objects and up-to 3,500,000 metrics.

    We all know that the main cluster nodes of vROps can also do collection and as per the sizing guidelines, a medium node can collect up to 7000 Objects, while a large cluster node which is 16 vCPU / 48 GB of ram can also collect up to 12000 Objects.

    ***Reference VMware KB - https://kb.vmware.com/kb/2130551

    SIZING SCENARIO:

    Now imagine a scenario, where you have a 4 Medium Node cluster with 4 node in Site A. You have a vCenter Adapter instance which has more than 7000 Objects (5000 VMs, 2000 Datastores, 200 ESXI Hosts etc). In such a situation, in order to collect data from this vCenter Adapter instance, you would have to up size your cluster node to a large node. Since vROps cluster nodes have to be symmetrical, you would have to up-size all your cluster nodes to LARGE NODES. In this situation you would have to invest on 32 vCPU (8 per cluster node to reach 16 vCPUs) and 64 GB of RAM (16 per node to reach 48 GB per cluster node). This in most cases is a huge change since you would have to ensure you have enough resources in the under lying cluster. In some cases you might also go beyond the NUMA boundary which we all know has some performance impact from a CPU standpoint.

    With all these concerns in place, it would an excellent opportunity to leverage the Remote Collectors in the local Site A as well. While the name says REMOTE, it is not necessary that remote collectors are deployed only on remote sites. They can also be utilized in a local site to collect data from adapter instances which can be large in size. Taken our example into consideration, we would just need 2 Remote Collectors ( 2 for high availability, in case one fails) to collect from the Site A vCenter. These 2 appliances will only cost as 8 vCPUs and 32 GB of RAM in total). This will reduce the resource requirements by more than half and also ensure that your cluster nodes have no pressure on collector and hence all that CPU and RAM can be utilized by the other roles on the vROps nodes which will eventually give better performance.

    So here would be the new architecture with Remote Collectors Everywhere!!!


    With this model, we have better performance, more scale and less hardware requirement for deploying large vROps Deployments. Another important thing to note is that you can always migrate from Design 1 to Design 2 or from Design 2 to Design 1 without any downtime or data loss. Hence if you are on the way to scale the environments being monitored by vROps, this tech tip would be very useful for you.


    Hope this helps with day to day datacenter operations using vRealize Operations Manager.


    Stay tuned for more goodies!