Showing posts sorted by relevance for query "Did you know #". Sort by date Show all posts

Wednesday, October 5, 2016

Did You Know #2 - Leveraging vROps Remote Collectors for Local Adapters!

In this part of the "Did You Know" series, I will talk about a small architectural tip which will not only help you enhance the performance of your vRealize Operations Manager cluster, it will also save you from up-sizing the cluster from let's say, medium to large nodes and at the end of the day save a ton of CPU & Memory in the process.

Did you know that vRealize Operations Manager uses Remote Collectors for collecting data from a Remote Datacenter and send it over to the centralized vROps cluster. The diagram below shows the actual purpose for which a remote collector was introduced in vRealize Operations Manager:


In the above example, we have a vROps Cluster in Site A. This cluster consists of 2 or more nodes which have a local collector module on them. This collector module collects the data from the local data sources, which are also known as adapter instances. Some examples of an adapter instances would be vCenter Adapter, NSX Adapter, MPSD (management pack for Storage Devices) etc.

The Nodes of the cluster here have multiple roles to play. They not only collect the data from the data sources, they also have to crunch this data using the analytics engine, calculate dynamic thresholds, run the capacity engine and host all the data through the CASA and Web UI. 

On the other hand in Site B, we have a remote collector group with 2 or more remote collectors (in a HA mode). Their role is to collect the data from the Site B data sources using the Collector framework on each node and send that data over to the centralized cluster in Site A. The Remote Collectors are small form factor of the vROps appliances which are stateless and the only role thy have is to collect data. Here are a few facts which make them great for playing the role of a collector from a sizing standpoint.

The come in 2 form factors ***: 

SMALL: 2 vCPU / 4 GB RAM. A small RC can collect 1500 Objects (an object can be a VM, Datastore, ESXi Host, LUN, etc) and upto 600,000 metrics. (1 VM usually creates around 250 metrics).

LARGE: 4 vCPU / 16 GB RAM. A small RC can collect 12000 Objects and up-to 3,500,000 metrics.

We all know that the main cluster nodes of vROps can also do collection and as per the sizing guidelines, a medium node can collect up to 7000 Objects, while a large cluster node which is 16 vCPU / 48 GB of ram can also collect up to 12000 Objects.

***Reference VMware KB - https://kb.vmware.com/kb/2130551

SIZING SCENARIO:

Now imagine a scenario, where you have a 4 Medium Node cluster with 4 node in Site A. You have a vCenter Adapter instance which has more than 7000 Objects (5000 VMs, 2000 Datastores, 200 ESXI Hosts etc). In such a situation, in order to collect data from this vCenter Adapter instance, you would have to up size your cluster node to a large node. Since vROps cluster nodes have to be symmetrical, you would have to up-size all your cluster nodes to LARGE NODES. In this situation you would have to invest on 32 vCPU (8 per cluster node to reach 16 vCPUs) and 64 GB of RAM (16 per node to reach 48 GB per cluster node). This in most cases is a huge change since you would have to ensure you have enough resources in the under lying cluster. In some cases you might also go beyond the NUMA boundary which we all know has some performance impact from a CPU standpoint.

With all these concerns in place, it would an excellent opportunity to leverage the Remote Collectors in the local Site A as well. While the name says REMOTE, it is not necessary that remote collectors are deployed only on remote sites. They can also be utilized in a local site to collect data from adapter instances which can be large in size. Taken our example into consideration, we would just need 2 Remote Collectors ( 2 for high availability, in case one fails) to collect from the Site A vCenter. These 2 appliances will only cost as 8 vCPUs and 32 GB of RAM in total). This will reduce the resource requirements by more than half and also ensure that your cluster nodes have no pressure on collector and hence all that CPU and RAM can be utilized by the other roles on the vROps nodes which will eventually give better performance.

So here would be the new architecture with Remote Collectors Everywhere!!!


With this model, we have better performance, more scale and less hardware requirement for deploying large vROps Deployments. Another important thing to note is that you can always migrate from Design 1 to Design 2 or from Design 2 to Design 1 without any downtime or data loss. Hence if you are on the way to scale the environments being monitored by vROps, this tech tip would be very useful for you.


Hope this helps with day to day datacenter operations using vRealize Operations Manager.


Stay tuned for more goodies!


Sunday, October 2, 2016

Did You Know #1 - Controlling Alerts Storms During Maintenance with vROps!

Welcome to a new series of "Did You Know" Facts about vRealize Operations Manager! With this series, I will help unearth the Best Kept Secrets of vRealize Operations Manager. 

This could be across, features, functionalities, use cases, integrations, APIs or any tips or tricks which can help make day to day operations of Software Defined Datacenter easier and fun with vRealize Operations Manager!

In this first part of the series, we will look at a generic activity of maintenance which is applicable to every datacenter. In most environments activities like patching, power cycle, upgrades, hardware replacements etc are conducted during change windows. While all these activities are important, it is also important that you use the Maintenance Schedules or Maintenance options on vRealize Operations manager to disable any activity on objects which are under any kind of maintenance. This will help you ensure that you do not trigger any FALSE alerts which you might have configured on that object type.

For instance, if you have an alert which would trigger when a virtual machine is powered off, you should ensure that you put virtual machines in maintenance if you are planning to shut them down due to a scheduled downtime for activities such as patching, migrations, hardware version upgrades etc.

To do this follow the steps mentioned below. Do note that you should be on vROps 6.x or above to make use of these steps:

The GUI way:

1- Login to vRealize Operations Manager instance using credentials with permission to perform maintenance activities. Use admin if you do not have a strict Role Based Access Control (RBAC)

2- Click on Administration -> Inventory Explorer

3- On the top right corner of this page, search for the Object which you want to put in maintenance, in my case I want to upgrade my SQL server from SQL 2008 to SQL 2012, hence I will search for this VM.


4- Once I see the Virtual Machine in the List, I just need to select the same and click on the Maintenance Icon:


5- You will see pop-up which you can use to enter the details of maintenance window on this object. You have the option of either entering the maintenance in minutes or an end date.


That's it. This will ensure that the concerned object is in maintenance and I will not get any alerts for the same when I reboot.

In case you choose the first option to end the maintenance manually, please ensure that you do the same, as soon as you are done with the change you were implementing. You would need to come back to inventory explorer, search for the Virtual Machine, select the Virtual Machine name, and click on End Maintenance as shown below:


The API way:

For the cool kids out there, you can also do this programatically by using the vRealize Operations Manager API. Here are the API details, along with JSON and XML sample requests which can be used to build a script or a workflow and you can put one or multiple Objects into maintenance easily. You can use the API calls to end the maintenance as well.

To access the API documentation, you will need to access the following URL:

https://<your-vrops-ip-or-fqdn?>/suite-api/docs/rest/index.html


Hope this helps with day to day datacenter operations using vRealize Operations Manager.


Stay tuned for more goodies!


Monday, October 17, 2016

Did You Know #5:Customizing Summary Pages on vRealize Operations Manager!

With this article of the Did You Know series, I wanted to share a GEM of a feature using which can enhance your user experience and user interface of vRealize Operations Manager. If you have used vRealize Operations Manager, you will notice that the product has summary pages for each object type. For instance if you are on vSphere World Object, you would see a Summary Page which looks like this:


In-fact, if you click on any other object types such as vCenter, Datacenter, Clusters, Hosts etc. you would see a similar summary page showing the Health, Risk & Efficiency of the Object Type which you have selected. The Health, Risk & Efficiency badges on this page are colored based on the Alerts triggered on the Object type which you have selected on the navigation pane in the left.

While this view is useful to summarize the alert status, this might not be the default page which you want to see when you select an object type. If that is the case, vRealize Operations Manager provides you the option to change this default summary page to the dashboard of your choice (I have seen this feature on vROps 6.2 and 6.3). In my opinion this is a super cool feature as now yo can create your own summary pages using vROps Custom Dashboards and then use them as default summary pages (only applicable to license editions where you can create custom dashboards)

Here is how you do it:

Create a custom dashboard for the object type which you want to chose as the summary page beforehand.

1- Login to vRealize Operations Manager using Administrative Privileges. (preferably admin account).

2- Click on Content -> Dashboards -> Blue Wheel Icon -> Manage Summary Dashboards


3- Click on the drop-down to select the Adapter Type under which you want to select an Object Type for which you want to change the summary page.


4- In my case I want to change the Home Page for the vSphere World and hence I will select the vCenter Adapter, which will list all the object types under that adapter.


5- We will select the vSphere World from this list and click on the gauge shaped icon to Assign a Dashboard for this Object Type.


6- Once I click on that icon, I will get a list of all the dashboards I have in my vROps instance. I will go ahead and select the dashboard which I wish to chose, in this case I will select the Workload Utilization dashboard and click on OK to save the changes.


6- Let's go back to vSphere World and see how the summary page looks like after this change. Click on Environment -> vSphere Hosts and Clusters -> vSphere World.

You can now see a completely different home page than what you usually see. 


This will help you enhance your instances of vROps with you self customized dashboards and help you jazz up your deployment with personalized views at each object level..

Hope this helps with day to day data-center operations using vRealize Operations Manager.


Stay tuned for more goodies!!


Tuesday, March 21, 2017

Did You Know #6 - Using custom metrics groups in vROps for troubleshooting


Welcome back to the Did You Know Series on vRealize operations Manager. As I mentioned in the first part of this series, the goal here is to unearth the Best Kept Secrets of vRealize Operations Manager. 

This could be across features, functionalities, use cases, integrations, APIs or any tips or tricks which can help make day to day operations of SDDC easier and fun with vROps!

Today I will talk about how you can make troubleshooting an easier process with vROps. Troubleshooting as we all know is not a skill, it is a methodology. It would NOT be incorrect to say that each one of us has a different troubleshooting style. With vRealize Operations you can troubleshoot issues the way you like them. Some prefer OOTB dashboards, some like to create there own personalized views and some prefer to jump into what me and Iwan call God Mode aka the All Metric view in the product.

The All Metrics view of the product can easily become complex as it shows you all the metrics which are associated to an Object Type. If you look at vRealize Operations Manager 6.4, the product gave you some OOTB custom metric groups which can be used to list all common metrics around CPU, Memory and Disk. These were the OOTB options and might not fit all the needs. If you are on vROps 6.4, click on a VM object and click on All Metrics and you will see this:


You can see that apart from all metrics and all properties for the virtual machine, you can see 5 custom categories which list specific metrics which can be used for troubleshooting. As soon as I double click on CPU, I will see all the key metrics pertaining to the CPU Metric group in one shot on the right pane:


While this is a cool feature and make troubleshooting really simple, there was one use case which could not be solved here. If as an admin I wanted to create my own metric group where I want to focus on key metrics of my own choice, I was unable to create a metric group for same. While this was not possible with vROps 6.4, with the arrival of vROps 6.5, this feature is now available and now you can create your own custom metric groups with the metrics you like to use for troubleshooting.

I will show you how to create one custom group at virtual machine level:

1- Click on any virtual machine in your environment.

2- Click on All Metrics.

3- Click on the blue wheel and click on the Add Group option.


4- Provide a name. I will call it "VM KPIs"


5- Now you can drag and drop any metric from the all metrics group to this new created metric group:


Here are a few KPIs which I added in my vROps as they help me troubleshoot in God Mode with a single click.....

VM KPIs

CPU | Demand %
CPU | Usage %
CPU | CPU Contention %
CPU | CO-Stop %
CPU | Ready %

Memory | Usage %
Memory | Contention %
Memory | Balloon %
Memory | Swap In (KB)
Memory | Compressed (KB)

Virtual Disk | Aggregate of all instances | Commands Per Second
Virtual Disk | Aggregate of all instances | Total Latency
Disk Space | Snapshot | Virtual Machine Used (GB)
Guest File System Stats | Total Guest File System Free (GB)

Network I/O|Aggregate of all instances| Packets Dropped %


Host System KPIs

CPU|CPU Contention (%)
CPU|Demand (%)
Memory|Contention (%)
Memory|Total Capacity (KB)
Memory|Consumed (KB)
Memory| Usage (%)
Network I/O|Aggregate of all instances|Packets Dropped (%)


Cluster KPIs

CPU| CPU Contention (%)
CPU|Demand (%)
CPU|Max VM CPU Contention (%)
Memory|Balloon (KB)
Memory|Contention (%)
Memory|Max VM memory Contention (%)
Memory|Usage (%)


 Go configure your vROps with the metrics you like and make troubleshooting an easy and fun process...

And yeah. Keep sharing!!


Thursday, October 13, 2016

Did You Know #4 - Restricting Virtual Machine Collection on vROps!!

Welcome back to the part 4 of the did you know series on vRealize Operations Manager. This series is all about small nuggets on vRealize Operations Manager, which can help you with day to day IT operations in your Software Defined Datacenter.

With this article, I wanted to make you aware of a setting which allows you to filter out virtual machine objects from collection in vRealize Operations Manager. While this was always possible by using a collection user with limited rights on objects in vCenter, this feature is natively available with vROps 6.1 and beyond.

With this option, you can limit the number of virtual machines from collection on a vCenter Adapter. In my case, I used this option to disable collection of Virtual Machine Object completely. This would mean that I would only collect data from the remaining objects which is vCenter Server Object, Datacenter Object, ESXi Hosts, Datastores etc. So basically everything except the VM objects. The use cases for this deployment model are following:-

I- Infrastructure Monitoring - In this case the IAAS provider just wants to leverage vROps for monitoring the underlying infrastructure and have no responsibility of monitoring the VMs

II- Centralized Dash-boarding & Reporting for large scale deployment - Another use case is to have a centralized vROps with reporting and dash-boarding capabilities, especially large scale deployments. In cases where an organization has multiple sites across the globe, they might not want a centralized vROps instance to avoid traffic flowing across the globe. While they would want to monitor individual sites with a full fledged vROps deployment, they might want to collect infrastructure level data into a centralized vROps for reporting purposes.

Please Note: It is recommended that you DO NOT disable VM Object collection without understanding the full impact of this change. While this will give you scalability, it will not bring VM Data which might be used for calculating metrics at Host or Cluster level. Please use this only for specific uses cases and preferably in a development environment to understand the full impact, before rolling out in production.

I am sure there would be other uses cases which could be solved with this feature. Here is where you can set it up:

In case of an EXISTING deployment:

1- Login to vROps with administrative privileges (preferably admin account) 

2- Click on Administration -> Solutions

3- Click on the VMware vSphere 

4- Select the Adapter Instance where you want to change under the "VMware vSphere Solution Details" and click on the wheel shaped Configure Icon.

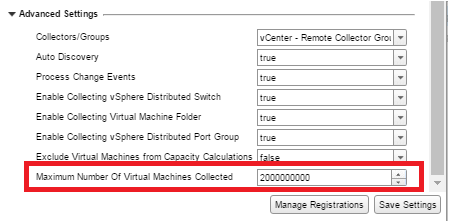
5- Expand the advanced settings of the adapter. Here you will see an option of "Maximum Number of Virtual Machines Collected"  with a default value of "2000000000". This is the virtual machine count you can collect with this adapter instance.

6- To disable VM collection completely, change this value to "0" (ZERO)


7- Click on Save Settings to save the new setting.


In case of a NEW deployment:

The steps to be followed in case of a new deployment will be exactly the same. You would define this number at the time of configuring the adapter instance for the first time.


Hope this helps with day to day data-center operations using vRealize Operations Manager.


Stay tuned for more goodies!


Tuesday, July 29, 2014

Part 1 : VCDX - The Saga Of The Lost Title : The Design

Last week, while I was winding up my workday, I tweeted about writing a post which would reflect my experience about my unsuccessful yet fruitful VCDX defense on 9th July 2014 in Singapore. A number of my twitter mates, replied to the tweet and supported my idea of sharing the experience with others, who like me aspire to get the title of a VMware Certified Design Expert.


While it is obvious to feel bad, this attempt of mine has given me the lesson of my life. I relate this lesson to the philosophy of an ARROW. If you notice an arrow, it is always pulled back to give it the focus and force it needs to go and hit the target.

Similarly, in life their are times when you are pulled back due to failures, but it is to ensure that you focus come back stronger and harder to hit the aim and be successful. I am in absolute awe of this analogy and will ensure that I apply all I have learnt from my mistakes and get the Title. It's not about life and death but I always believe in challenging myself. 

Just a week before my defense, I wrote about WHY I want to be VCDX, and how I got on to this journey and the quest which still continues. In that post I did mention about the importance of getting on the journey without worrying about the result. Needless to say that my thought process is still the same, however now I am wiser after that fantastic experience of preparing my VCDX design, preparing for my VCDX Defense and then actually defending my design in front of the VCDX Panelists.

The aim of this series is NOT to narrate the entire story of my journey to the VCDX defense, but I want to share the mistakes I made on the way to ensure that others who are either on this journey or want to be here in the future should not repeat these mistakes and come out successful in their quests to become a Certified Design Expert :-)

While I would have loved to write this post as a success story with a VCDX# next to my name, I believe that someone who has failed would do more justice to such a post. While I would go through the ups and downs of my experience, this is NOT an attempt to break the NDA or divulge information which might give undue benefit to someone attempting the certification. Alright let's get started with the process and for your benefit break this process into 3 Major Areas & 3 Different posts.

Part I - The VCDX Design

Part II - Design Defense Preparation 

Part III - Design Defense


In this post I will we covering the Part 1 - The VCDX Design.


The VCDX Design

The VCDX Design is the foundation of your VCDX title. As someone has rightly said, if the foundation of a building is weak, it is bound to fall one day, hence lets talk about how to build a strong foundation.


  • TIME TO DESIGN - The creation of the the VCDX design whether REAL, FICTITIOUS or REAL + FICTITIOUS should be given the maximum amount of time in the entire process. I would recommend close to 6 to 8 months before the date of defense is an ideal time to prepare a design which is VCDX Panel Proof (Nothing is panel proof though ;-) )

  • FILL THE GAPS - Most of you doing design work in the field would agree that it is difficult to find a customer who would give you the opportunity to work on all the areas of the VCDX Blueprint. In other words, I will be HIGHLY SURPRISED if someone has ever used a 100% REAL DESIGN for their VCDX defense. At the end of the day you will find GAPS in your design - FIND THEM AND FILL THEM & most importantly VALIDATE THEM to ensure they do not stand out as fictitious choices.

  • DESIGN VALIDATION - Design Validation is a key process in your preparation of VCDX. It is not only difficult to find people who can do a honest review, it is also nearly impossible that a single reviewer will discover all the holes in your design. Remember, you need to be close to the reality and hence ensure that you have atleast 3 reviewers (your design will be reviewed by 3 panelists) of your design atleast 60 days before submission and you give them atleast 30 days to review and give yourself the remaining 30 days to make changes and do a CHANGE FREEZE to the design. Remember this is the only way you can find the gaps which I mentioned in the previous point.

  • ROLE OF STUDY GROUP & VCDX MENTOR - It is needless to say that you should enroll yourself in a study group and get a VCDX mentor assigned. It is a crime if you are not doing so. Assuming you will do so, please remember that you cannot get success with a study group and a mentor if they were not involved at the right stage of your preparation. The study group will not only give you critics who can review your design decisions, but will also give you an opportunity to learn about more designs belonging to your peers. This will be your opportunity to not only help yourself by learning new things, adopting them and improving your design, but should also be seen as an opportunity to help and guide others. Similarly, a VCDX mentor cannot really help you if you have not given him the opportunity to guide you at the right time. In my opinion, you should join a study group atleast 3 months before submission and get a mentor atleast 2 months before submission (which will give you 3 months with the VCDX mentor in total). 

  • CHOOSING YOUR VCDX DESIGN - I took some time to chose my VCDX design and as you all know I could not clear VCDX in my first attempt. Honestly speaking it will be difficult to ditch your design if you fail VCDX. You would want to improve the same design, fill those gaps and come back better prepared with the same but improved design the next time. It might be difficult to create a complete new design the second time around if you happen to fall short of the finishing line the first time, hence take time to chose your design. For people looking to create a fictitious design, read this post by Niran Even-Chen, he recently got his VCDX Title and he pulled it off a 100% Fictitious Design.

  • DESIGN DEPTH - In order to be successful with your defense (which I will write about in a future post), it is important that your design speaks of your work experience and most importantly the design choices. Remember, it is important that you cover each area of the blueprint here and go from Conceptual to Logical & then Physical to demonstrate your knowledge. Well the key thing I want to highlight here is that VCDX is not about VMware and its products. It is about each area which is impacted, affected or altered by this disruptive technology, hence it is important that you know them all and have atleast Architecture Level Proficiency in these areas (e.g. Networking, Storage, Backup, Disaster Recovery, Security etc). Since Design Documentation is a great scoring opportunity and you need them all, give your best at this to score maximum. It is not necessary that your design document should be hundreds of pages, but it should have concise and complete information about your design decisions and why you took them. Avoid writing about how a feature works and best practices, instead write why you chose it and how it meets the requirements. I would suggest to create your VCDX presentation is parallel to your Design as it is a reflection of your design document. This will ensure that you have a rough cut presentation ready with all the diagrams/figures you have placed in your architecture design. This will make your design document readable and will also help the panelist to follow you easily when you present the design during the defense.


  • DESIGN DECISIONS - These are the meat of your VCDX foundation i.e. your architecture design. While you are documenting your design and decisions, it might be a good idea to document alternative options and what if scenarios and keep it for your reference as this would help you later when you prepare for your defense. If you have taken a design decision and you are not sure why you did it and how it impacts the other requirements and areas of your design then mark my words, the panelists will find it and ask you questions on that. Hence, it is important that you have a solid ground behind any design decision you have taken and are well versed with the impact of the same on the other areas of your architecture design and the related environment. The key thing to remember is that you CAN take the weirdest of the design decision, but it should meet the requirements and you should be aware of the impact. At the same time to know an alternate would be critical as well.


  • DESIGN SUBMISSION - You will get a notification from VMware Certification Team to submit your design by a date and time. The worst thing you could do is to submit your design at the last moment or very early. Life is all out balance and it applies here as well. You should neither be running out of time nor you should submit it  before you are completely satisfied. This will only happen to your satisfaction if you have had enough time to review and make changes. Having said that Design Submission is no way a well deserved break by any mean. Although you might feel that you are at the top of the world, you are actually not looking at the bigger picture. Hence a break often at this point can distract you, so focus and come back hard at your preparations.


There are a lot of other key areas which are not covered in this post, but these are the areas where I know I faulted and I saw others struggling as well. I hope these learning's will help you in your VCDX preparations. 

I will come back soon with the other parts if this short series.

Till then - Stay Tuned!!


Share and Spread the Knowledge!


Monday, October 10, 2016

Did You Know #3 - Using Wait Cycles for Time Based Alerts in vROps!


In this part of the "Did You Know" series, I will provide you a tip, using which you can create time based alerts in vROps. I am happy to share that this was an output of a brainstorming session with a customer and at the end of the discussion the customer himself proposed this solution and I was immediately testing the idea in my lab with successful results.

The use case for the time based alert in our situation was to create an alert which would trigger if a virtual machine is running on a snapshot for more than 24 hours and if the snapshot space on that virtual machine is more than 0 GB.

The challenge with this requirement is around the time factor. Different workloads can have different impact of running on snapshots. For instance a web server running on a snapshot might not be impacted much from a performance standpoint, however an Oracle database VM running on a virtual disk snapshot would definitely not be a happy camper at the time it's running database transactions. Just to be clear, we are discussing vSphere snapshots here and not any other snapshot technologies. With vROps, there is no metric today which tracks the snapshot on the basis of time. While there are metrics which define the age of the snapshot, using these metrics for alerts become impossible, as for each snapshot a new directory is created, under which a snapshot drive is created and it increments in size. As soon as you delete this snapshot and take a new one on vCenter, vROps creates a new directory for this new snapshot and hence it is difficult to track hundreds of directories which keep changing, specially in an environment where snapshots are heavily used.

In order to overcome this situation, we will create a new alert. If you are new to Alerts in vROps, I would highly recommend that you watch this episode of my yearly long Webinar Series to get well equipped about vROps Alerts and Symptoms.

We will start by creating a new symptom & an alert definition:


1- Login to vROps with credentials having rights to create new Alerts/Symptoms (admin credential would be nice).

2- Click on Content -> Symptom Definitions. You will be under the metric/property symptom definitions category by default.

3- Click on the sign to add a new Symptom.

4- Here is how you will define the new symptom. Refer to the screenshot for more details:

  • Base Object Type : Virtual Machine
  • Metric Name : Disk Space|Snapshot|Virtual Machine Used (GB)


5- Double click on this metric to add it to the right pane where we will describe this symptom.

6- Here is how will you provide the details:

  • Static Threshold
  • Symptom Definition Name : Virtual Machine is running on a snapshot for more than 24 hours
  • Critical
  • Condition : When Metric is > 0 (This is the size of the snapshot)
  • Advanced : Wait Cycle - 288 (Each cycle is 5 minutes, hence the total minutes we will check for this condition is 1440 minutes which is 24 hours)
  • Advanced : Cancel Cycle - 1 (Once the condition is false, the alert will be cancelled in 5 minutes)


7-  Click on Save to save this symptom. Once done we will create a new alert using this symptom.

8- Click on Content -> Alert Definitions. Click on the sign to add a new Alert and provide the following details:

"1. Name & Description"

Name - Virtual Machine is running on a snapshot for more than 24 hours
Description - This alert will trigger when a virtual machine is running on a snapshot for more than 24 hours.


"2. Base Object Type"

Virtual Machine


"3. Alert Impact"


"4. Add Symptom Definitions"

Symptom Name : Virtual Machine is running on a snapshot for more than 24 hours


"5. Add Recommendations"

Add any recommendations from the available list or create your own.

9- Click on Save. This will create a new alert definition and this alert will be enabled on the default policy by default.


Please note that the Wait Cycle will start counting as soon as you create this alert definition, hence this alert will take atleast 24 hours to trigger. If you have VMs with snapshots (more than 24 hours old) in your environment, don't expect the alert to trigger immediately. The countdown to 24 hours will begin when you enable the alert in the policy.

You can see that we used a Time Based symptom to solve a key problem which emerges and could lead to a number of issues in a virtual environment. Hope this will give you ideas on  how you can create more time based alerts using metric based symptoms.

Hope this helps with day to day datacenter operations using vRealize Operations Manager.


Stay tuned for more goodies!


Tuesday, September 18, 2012

Changing Swap file Location of VMware vSphere Virtual Machines

While working on a SRM project for a customer, I came across a situation where the customer wanted to minimize the amount of data which we need to replicate at the storage layer for the virtual machines to be available at the DR Site. We are using Storage Array based replication and not vSphere Replication in this case.

The best bet is to ignore the files which are not required to be a part of the DR VM. In a virtual machine a file which you can readily ignore is a .vswap file as this is a resultant file which is used by Virtual machines for swapping memory pages. To read more about virtual machine swap file, refer to this post by Frank Denneman. This would give you a good insight about Virtual machine Swapfiles.


Lets quickly look at what we need to do and consider to perform the relocation of the Swapfiles to a shared datastore (You can keep it on a local datastore as well, however this will increase the time taken to vMotion a Virtual Machine from one host to another since a full copy of the swap file would happen, the post above by Frank explains the same.


Changing the location of Virtual Machine SWAP file to a Shared Datastore

Note:- To change the location of the SWAP files of all the virtual machines in the virtual infrastructure follow the steps below:-

      1-     Connect directly to your host or to your vCenter Server using the VMware Infrastructure/vSphere Client.

      2-     Configure the setting on the Cluster level first by Right Clicking on the cluster in question and click on Edit      Settings, select the Swapfile Location and select the option “Store Swapfile in the datastore specified by host”.

(screenshots courtesy - SOS Tech - Wordpress)


The next step would be to set it up on each and every host in the cluster

      3-     Click the Configuration tab for the ESX host.

4-     Click Virtual Machine Swapfile Location and click Edit.

(screenshots courtesy - SOS Tech - Wordpress)


      5-     Specify the datastore where you want to store the virtual machine swap files.

      6-     After restarting your virtual machines, ensure the swap file is located on the specified host datastore.

      7-     An important point to note is that you would have to redo this setting on a host every time the HOST   is removed from the cluster or else the Swapfile location will default to with “Virtual Machine Files”.

Please ensure that we size this datastore appropriately for performance and Space. The space should be greater than or equal to the total vRAM assigned to the all the Virtual Machines in the Environment. Please ensure you size for future growth as well.

The performance of this datastore is important as the SWAP files help a VM swap out memory pages when the host is memory constrained, hence this datastore should be backed up by disks which have good performance characteristics. With vSphere 5.1 you can actually select the datastore for storing the swapfiles as a SSD based location which will improve the performance drastically.


You can also configure only specific virtual machines for redirecting there SWAP files, however this would incur management overhead. If you need to do this, you can follow the steps below (Reference VMware KB article 1004082)

To change the swap file location for a single virtual machine:
  1. Power off the virtual machine.
  2. Unregister the virtual machine. Right-click the virtual machine in the Inventory and choose Remove from Inventory.
  3. Connect to the host:
  4. Change directory to the folder where the virtual machine resides:

    cd /vmfs/volumes/datastore_name/virtual_machine_folder
  5. Edit the virtual machines configuration file with a text editor.
  6. Add this line:

    sched.swap.dir = /vmfs/volumes/datastore/ 
  7. Register the virtual machine again. For more information, see Registering or adding a virtual machine to the inventory (1006160).

Hope this helps people who have to take similar decisions for their Virtual Environments.


*********************************************************************************
Update to the article (20th Sept. 2012)
*********************************************************************************


Happy to share that this article got a lot of traction in the last 4 days and there were a number of discussions which happened over the web, however unfortunately, those discussions were not updated here automatically. I wish there was a feature to do that... 

So for the benefit of all... I am updating the discussions in a question and answer format..

FAQ's

Ques: How does this affect performance of the VMs if the swap is on another datastore? We are re-architecting the vm environment.

Ans: The Performance of the VM's would be affected if you locate them on a storage LUN which could be under-performing due to the characteristics of the LUN. For ex- if the LUN is carved out of slow SATA disks. 

Just relocating the swap files to a different LUN does not result in performance issues. 
Another issue could be a slowness in the process of vMotion if the swap files are not located on a share storage (instead the are on a local storage.) 


Ques: From a architecture view, if we have all the swap space setup on a single lun for the production environment, would we need a corresponding same size lun setup for the dr site? Or would it be better just to have the vm take care of the swap at the dr site? 


Ans: I would not suggest you to dedicate a lun for Swap files in DR site, because this storage space would be kept idle for most of its life. Storage being expensive you might not want to keep it idle. Instead, let the VM's boot with the swap file with the virtual machine file. 

However, if you ever get into a failover situation and run VM's from the DR site, at the time of failback the Swap files would be replicated back to the Primary site, creating a similar situation which you have in hand today. Still the cost to replicate this during Failback might be much less as compared to idle storage space of this capacity. 

Chose what suits your environment the best. 


Ques: After reading your blogpost, need your inputs 

- As you might be aware storage vmotion creates a temp second vswp file on the source, so how did you size the .vswp datastore to incorporate storage vmotion functionality 

- In the scenario you shared how did you addressed a memory overhead vswp file "VMX swap file" created with each VM post ESXi 5.0 

- If I assume business critical VM's part of your SRM scenario do not undergo frequent power cycles and the solution architect correctly for configured and memory reservation the .vswp file will be static with no changes to storage blocks post first full copy would you still recommend a dedicated .vswp datastore


Ans 1 (By Samir Roshan of - http://thinkingloudoncloud.com/)

By default now you have two vswp files in a VM directory one is old good friend swap file and the new VMX swap file. More details here http://pubs.vmware.com/vsphere-50/index.jsp?topic=/com.vmware.vsphere.resmgmt.doc_50/GUID-51767DC5-9A03-4B41-A385-9A11F6BD36F1.html

There are also chances of the .vswp storage block changes as the .vswp file is not a static file although it may seem so (due to it's size calculation on the datastore) but remember this is used for swapping and it is not guaranteed that the same memory pages are swapped all the time.

Now the SRM and swap file connection, in SRM your VM is going to have a reboot any way in the DR site in that case the vswp file is an additional load that you have to carry even for the initial copy. As we know the .vswp file gets created when the VM is powered on and it gets deleted when the VM is powered off.

So in SRM it's good to have the .vswp files stored in some other datastore than the one participating in the Protection group.

Local swap files with SSD is a good design consideration which can give better performance if there is swapping.


Ans 2: To start with I would not setup dedicated datastore for virtual machines unless I have to implement SRM in the environment, as this adds some complexity in the environment. 

As we all know that when we look at Interoperability with Storage vMotion and Storage DRS 

"Due to some specific and limited cases where recoverability can be compromised during storage movement, Site Recovery Manager 5.0.1 is not supported for use with Storage vMotion (SVmotion) and is not supported for use with the Storage Distributed Resource Scheduler (SDRS) including the use of datastore clusters. If you use SVMotion to move a protected virtual machine from a datastore that is in a protection group to a datastore that is not protected, you must manually reconfigure the protection of that virtual machine." 

The above extract from the SRM Release notes clearly shows that its not a great idea to use storage vmotion for vm's which are protected by SRM, since it would result in a reconfiguration of protection group, or a resync of entire data in case of vSphere Replication... 

To your second point, in case you need to do a storage vMotion, you would have to have extra space on the data store as the storage vMotion would create a new swapfile for the period of storage vmoition... Since you would not perform a storage vmotion on all the vm's at the same time, a 20% head room on the Swapfile LUN should be enough to help any environment.... 

To your third point, I agree that your super critical machines would not Swap out as much, however the files will be created... So if you have around 50 machines which you are protecting with 4 GB of swap each, you have to replicate around 200GB of the data which is of no use.... Companies can burst out bandwidth to do so, however it comes with a cost..... 


Ques: Very helpful note. BTW i have this suggestion if you want to keep the Swap file locally(its just idea only i have never tested it, so pleas feel free to feed back) 

Why not we plan future esx hosts with at lease 64GB SSD for Swaps. As i think this this solves 2 issues 
1. improve performance of VM due to swap out. 
2. improves vmotion if the swap is on local DS. 

I understand this is not for all environments but can used for most of them and its justifiable from the cost factor also. 


Ans: The suggestion is great and I completely agree with you on this... SSD is the way to go for local swapfiles... Infact it is a Performance Best Practice by VMware. Refer to following link for more

http://www.vmware.com/pdf/Perf_Best_Practices_vSphere5.0.pdf


*********************************************************************************
Update to the article (22nd Sept. 2012)
*********************************************************************************


Alright, this discussion is heating up and we have got some great comments adding a couple from

Placing swap on SSD won't help vMotion performance - in fact it will hurt it as we now need to 
copy the swap file from one host to another in order to move the VM. If vMotion performance is 
a concern keep the swap on shared storage so it doesn't have to be moved when the VM is 
migrated. 

Ideally and if your VMs and hosts are sized appropriately, swap thrashing shouldn't be a 
problem so the placement of the swap file should have a negligible effect on performance 
anyway. 

What I generally do if dealing with replicated storage is place the swap on a shared datastore that is not replicated. 

You can definitely do that but keep in mind that you will get no performance gains other than faster reboots of the ESXi host. Once ESXi is loaded it runs from memory so having a faster boot device provides no benefits.