Showing posts sorted by date for query "Did you know #". Sort by relevance Show all posts

Sunday, June 4, 2017

Top vBlog 2017 - Time to Choose the Top Blogs in the Virtualization Space!

Eric Siebert recently opened the Top vBlog 2017 voting on vSphere-Land. Like every year, it is important that we vote the best in business to keep the bloggers motivated. So let's pay back from the community to the bloggers by showing some love for their content and efforts.

It is a democratic process and hence I would not share the list of people I have voted for as this might influence your decision ;-)

Here are a few things to keep in mind while voting. (Copying from Eric's post)

  • Longevity – Anyone can start a blog but it requires dedication, time & effort to keep it going. Some bloggers start a blog only to have it fall to the wayside several months later. Things always come up in life but the good bloggers keep going regardless of what is happening in their life.
  • Length – It’s easy to make a quick blog post without much content, nothing wrong with this as long as you have good content in the post that people will enjoy. But some bloggers post pretty long detailed posts which takes a lot of time and effort to produce. The tip of the hat goes to these guys that burn the midnight oil trying to get you some great detailed information.
  • Frequency – Some bloggers post several times a week which provides readers with lots of content. This requires a lot of effort as bloggers have to come up with more content ideas to write about. Frequency ties into length, some do high frequency/low length, some do low frequency/high length, some do both. They’re all good and require a lot of time and effort on the bloggers part.
  • Quality – It all comes down to whats in the blog post regardless of how often or how long the blog posts are. After reading a blog post if you come away with learning something that you did not previously know and it benefits you in some way then you know you are reading a quality post. Good quality is usually the result of original content, its easy to re-hash something previously published elsewhere, the good bloggers come up with unique content or put their own unique spin on popular topics.

Last year a few folks told me that it was difficult to find my blog, this year around Eric has stacked rank the top 50 blogs and vXpress (35) can be found right on the first page.


A special thanks to Eric for the efforts he puts in this activity and of-course the sponsors who support the community bloggers with their sponsorship for this event.


Tuesday, March 21, 2017

Did You Know #6 - Using custom metrics groups in vROps for troubleshooting


Welcome back to the Did You Know Series on vRealize operations Manager. As I mentioned in the first part of this series, the goal here is to unearth the Best Kept Secrets of vRealize Operations Manager. 

This could be across features, functionalities, use cases, integrations, APIs or any tips or tricks which can help make day to day operations of SDDC easier and fun with vROps!

Today I will talk about how you can make troubleshooting an easier process with vROps. Troubleshooting as we all know is not a skill, it is a methodology. It would NOT be incorrect to say that each one of us has a different troubleshooting style. With vRealize Operations you can troubleshoot issues the way you like them. Some prefer OOTB dashboards, some like to create there own personalized views and some prefer to jump into what me and Iwan call God Mode aka the All Metric view in the product.

The All Metrics view of the product can easily become complex as it shows you all the metrics which are associated to an Object Type. If you look at vRealize Operations Manager 6.4, the product gave you some OOTB custom metric groups which can be used to list all common metrics around CPU, Memory and Disk. These were the OOTB options and might not fit all the needs. If you are on vROps 6.4, click on a VM object and click on All Metrics and you will see this:


You can see that apart from all metrics and all properties for the virtual machine, you can see 5 custom categories which list specific metrics which can be used for troubleshooting. As soon as I double click on CPU, I will see all the key metrics pertaining to the CPU Metric group in one shot on the right pane:


While this is a cool feature and make troubleshooting really simple, there was one use case which could not be solved here. If as an admin I wanted to create my own metric group where I want to focus on key metrics of my own choice, I was unable to create a metric group for same. While this was not possible with vROps 6.4, with the arrival of vROps 6.5, this feature is now available and now you can create your own custom metric groups with the metrics you like to use for troubleshooting.

I will show you how to create one custom group at virtual machine level:

1- Click on any virtual machine in your environment.

2- Click on All Metrics.

3- Click on the blue wheel and click on the Add Group option.


4- Provide a name. I will call it "VM KPIs"


5- Now you can drag and drop any metric from the all metrics group to this new created metric group:


Here are a few KPIs which I added in my vROps as they help me troubleshoot in God Mode with a single click.....

VM KPIs

CPU | Demand %
CPU | Usage %
CPU | CPU Contention %
CPU | CO-Stop %
CPU | Ready %

Memory | Usage %
Memory | Contention %
Memory | Balloon %
Memory | Swap In (KB)
Memory | Compressed (KB)

Virtual Disk | Aggregate of all instances | Commands Per Second
Virtual Disk | Aggregate of all instances | Total Latency
Disk Space | Snapshot | Virtual Machine Used (GB)
Guest File System Stats | Total Guest File System Free (GB)

Network I/O|Aggregate of all instances| Packets Dropped %


Host System KPIs

CPU|CPU Contention (%)
CPU|Demand (%)
Memory|Contention (%)
Memory|Total Capacity (KB)
Memory|Consumed (KB)
Memory| Usage (%)
Network I/O|Aggregate of all instances|Packets Dropped (%)


Cluster KPIs

CPU| CPU Contention (%)
CPU|Demand (%)
CPU|Max VM CPU Contention (%)
Memory|Balloon (KB)
Memory|Contention (%)
Memory|Max VM memory Contention (%)
Memory|Usage (%)


 Go configure your vROps with the metrics you like and make troubleshooting an easy and fun process...

And yeah. Keep sharing!!


Monday, October 17, 2016

Did You Know #5:Customizing Summary Pages on vRealize Operations Manager!

With this article of the Did You Know series, I wanted to share a GEM of a feature using which can enhance your user experience and user interface of vRealize Operations Manager. If you have used vRealize Operations Manager, you will notice that the product has summary pages for each object type. For instance if you are on vSphere World Object, you would see a Summary Page which looks like this:


In-fact, if you click on any other object types such as vCenter, Datacenter, Clusters, Hosts etc. you would see a similar summary page showing the Health, Risk & Efficiency of the Object Type which you have selected. The Health, Risk & Efficiency badges on this page are colored based on the Alerts triggered on the Object type which you have selected on the navigation pane in the left.

While this view is useful to summarize the alert status, this might not be the default page which you want to see when you select an object type. If that is the case, vRealize Operations Manager provides you the option to change this default summary page to the dashboard of your choice (I have seen this feature on vROps 6.2 and 6.3). In my opinion this is a super cool feature as now yo can create your own summary pages using vROps Custom Dashboards and then use them as default summary pages (only applicable to license editions where you can create custom dashboards)

Here is how you do it:

Create a custom dashboard for the object type which you want to chose as the summary page beforehand.

1- Login to vRealize Operations Manager using Administrative Privileges. (preferably admin account).

2- Click on Content -> Dashboards -> Blue Wheel Icon -> Manage Summary Dashboards


3- Click on the drop-down to select the Adapter Type under which you want to select an Object Type for which you want to change the summary page.


4- In my case I want to change the Home Page for the vSphere World and hence I will select the vCenter Adapter, which will list all the object types under that adapter.


5- We will select the vSphere World from this list and click on the gauge shaped icon to Assign a Dashboard for this Object Type.


6- Once I click on that icon, I will get a list of all the dashboards I have in my vROps instance. I will go ahead and select the dashboard which I wish to chose, in this case I will select the Workload Utilization dashboard and click on OK to save the changes.


6- Let's go back to vSphere World and see how the summary page looks like after this change. Click on Environment -> vSphere Hosts and Clusters -> vSphere World.

You can now see a completely different home page than what you usually see. 


This will help you enhance your instances of vROps with you self customized dashboards and help you jazz up your deployment with personalized views at each object level..

Hope this helps with day to day data-center operations using vRealize Operations Manager.


Stay tuned for more goodies!!


Thursday, October 13, 2016

Did You Know #4 - Restricting Virtual Machine Collection on vROps!!

Welcome back to the part 4 of the did you know series on vRealize Operations Manager. This series is all about small nuggets on vRealize Operations Manager, which can help you with day to day IT operations in your Software Defined Datacenter.

With this article, I wanted to make you aware of a setting which allows you to filter out virtual machine objects from collection in vRealize Operations Manager. While this was always possible by using a collection user with limited rights on objects in vCenter, this feature is natively available with vROps 6.1 and beyond.

With this option, you can limit the number of virtual machines from collection on a vCenter Adapter. In my case, I used this option to disable collection of Virtual Machine Object completely. This would mean that I would only collect data from the remaining objects which is vCenter Server Object, Datacenter Object, ESXi Hosts, Datastores etc. So basically everything except the VM objects. The use cases for this deployment model are following:-

I- Infrastructure Monitoring - In this case the IAAS provider just wants to leverage vROps for monitoring the underlying infrastructure and have no responsibility of monitoring the VMs

II- Centralized Dash-boarding & Reporting for large scale deployment - Another use case is to have a centralized vROps with reporting and dash-boarding capabilities, especially large scale deployments. In cases where an organization has multiple sites across the globe, they might not want a centralized vROps instance to avoid traffic flowing across the globe. While they would want to monitor individual sites with a full fledged vROps deployment, they might want to collect infrastructure level data into a centralized vROps for reporting purposes.

Please Note: It is recommended that you DO NOT disable VM Object collection without understanding the full impact of this change. While this will give you scalability, it will not bring VM Data which might be used for calculating metrics at Host or Cluster level. Please use this only for specific uses cases and preferably in a development environment to understand the full impact, before rolling out in production.

I am sure there would be other uses cases which could be solved with this feature. Here is where you can set it up:

In case of an EXISTING deployment:

1- Login to vROps with administrative privileges (preferably admin account) 

2- Click on Administration -> Solutions

3- Click on the VMware vSphere 

4- Select the Adapter Instance where you want to change under the "VMware vSphere Solution Details" and click on the wheel shaped Configure Icon.

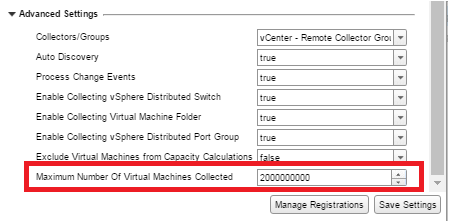
5- Expand the advanced settings of the adapter. Here you will see an option of "Maximum Number of Virtual Machines Collected"  with a default value of "2000000000". This is the virtual machine count you can collect with this adapter instance.

6- To disable VM collection completely, change this value to "0" (ZERO)


7- Click on Save Settings to save the new setting.


In case of a NEW deployment:

The steps to be followed in case of a new deployment will be exactly the same. You would define this number at the time of configuring the adapter instance for the first time.


Hope this helps with day to day data-center operations using vRealize Operations Manager.


Stay tuned for more goodies!


Monday, October 10, 2016

Did You Know #3 - Using Wait Cycles for Time Based Alerts in vROps!


In this part of the "Did You Know" series, I will provide you a tip, using which you can create time based alerts in vROps. I am happy to share that this was an output of a brainstorming session with a customer and at the end of the discussion the customer himself proposed this solution and I was immediately testing the idea in my lab with successful results.

The use case for the time based alert in our situation was to create an alert which would trigger if a virtual machine is running on a snapshot for more than 24 hours and if the snapshot space on that virtual machine is more than 0 GB.

The challenge with this requirement is around the time factor. Different workloads can have different impact of running on snapshots. For instance a web server running on a snapshot might not be impacted much from a performance standpoint, however an Oracle database VM running on a virtual disk snapshot would definitely not be a happy camper at the time it's running database transactions. Just to be clear, we are discussing vSphere snapshots here and not any other snapshot technologies. With vROps, there is no metric today which tracks the snapshot on the basis of time. While there are metrics which define the age of the snapshot, using these metrics for alerts become impossible, as for each snapshot a new directory is created, under which a snapshot drive is created and it increments in size. As soon as you delete this snapshot and take a new one on vCenter, vROps creates a new directory for this new snapshot and hence it is difficult to track hundreds of directories which keep changing, specially in an environment where snapshots are heavily used.

In order to overcome this situation, we will create a new alert. If you are new to Alerts in vROps, I would highly recommend that you watch this episode of my yearly long Webinar Series to get well equipped about vROps Alerts and Symptoms.

We will start by creating a new symptom & an alert definition:


1- Login to vROps with credentials having rights to create new Alerts/Symptoms (admin credential would be nice).

2- Click on Content -> Symptom Definitions. You will be under the metric/property symptom definitions category by default.

3- Click on the sign to add a new Symptom.

4- Here is how you will define the new symptom. Refer to the screenshot for more details:

  • Base Object Type : Virtual Machine
  • Metric Name : Disk Space|Snapshot|Virtual Machine Used (GB)


5- Double click on this metric to add it to the right pane where we will describe this symptom.

6- Here is how will you provide the details:

  • Static Threshold
  • Symptom Definition Name : Virtual Machine is running on a snapshot for more than 24 hours
  • Critical
  • Condition : When Metric is > 0 (This is the size of the snapshot)
  • Advanced : Wait Cycle - 288 (Each cycle is 5 minutes, hence the total minutes we will check for this condition is 1440 minutes which is 24 hours)
  • Advanced : Cancel Cycle - 1 (Once the condition is false, the alert will be cancelled in 5 minutes)


7-  Click on Save to save this symptom. Once done we will create a new alert using this symptom.

8- Click on Content -> Alert Definitions. Click on the sign to add a new Alert and provide the following details:

"1. Name & Description"

Name - Virtual Machine is running on a snapshot for more than 24 hours
Description - This alert will trigger when a virtual machine is running on a snapshot for more than 24 hours.


"2. Base Object Type"

Virtual Machine


"3. Alert Impact"


"4. Add Symptom Definitions"

Symptom Name : Virtual Machine is running on a snapshot for more than 24 hours


"5. Add Recommendations"

Add any recommendations from the available list or create your own.

9- Click on Save. This will create a new alert definition and this alert will be enabled on the default policy by default.


Please note that the Wait Cycle will start counting as soon as you create this alert definition, hence this alert will take atleast 24 hours to trigger. If you have VMs with snapshots (more than 24 hours old) in your environment, don't expect the alert to trigger immediately. The countdown to 24 hours will begin when you enable the alert in the policy.

You can see that we used a Time Based symptom to solve a key problem which emerges and could lead to a number of issues in a virtual environment. Hope this will give you ideas on  how you can create more time based alerts using metric based symptoms.

Hope this helps with day to day datacenter operations using vRealize Operations Manager.


Stay tuned for more goodies!


Wednesday, October 5, 2016

Did You Know #2 - Leveraging vROps Remote Collectors for Local Adapters!

In this part of the "Did You Know" series, I will talk about a small architectural tip which will not only help you enhance the performance of your vRealize Operations Manager cluster, it will also save you from up-sizing the cluster from let's say, medium to large nodes and at the end of the day save a ton of CPU & Memory in the process.

Did you know that vRealize Operations Manager uses Remote Collectors for collecting data from a Remote Datacenter and send it over to the centralized vROps cluster. The diagram below shows the actual purpose for which a remote collector was introduced in vRealize Operations Manager:


In the above example, we have a vROps Cluster in Site A. This cluster consists of 2 or more nodes which have a local collector module on them. This collector module collects the data from the local data sources, which are also known as adapter instances. Some examples of an adapter instances would be vCenter Adapter, NSX Adapter, MPSD (management pack for Storage Devices) etc.

The Nodes of the cluster here have multiple roles to play. They not only collect the data from the data sources, they also have to crunch this data using the analytics engine, calculate dynamic thresholds, run the capacity engine and host all the data through the CASA and Web UI. 

On the other hand in Site B, we have a remote collector group with 2 or more remote collectors (in a HA mode). Their role is to collect the data from the Site B data sources using the Collector framework on each node and send that data over to the centralized cluster in Site A. The Remote Collectors are small form factor of the vROps appliances which are stateless and the only role thy have is to collect data. Here are a few facts which make them great for playing the role of a collector from a sizing standpoint.

The come in 2 form factors ***: 

SMALL: 2 vCPU / 4 GB RAM. A small RC can collect 1500 Objects (an object can be a VM, Datastore, ESXi Host, LUN, etc) and upto 600,000 metrics. (1 VM usually creates around 250 metrics).

LARGE: 4 vCPU / 16 GB RAM. A small RC can collect 12000 Objects and up-to 3,500,000 metrics.

We all know that the main cluster nodes of vROps can also do collection and as per the sizing guidelines, a medium node can collect up to 7000 Objects, while a large cluster node which is 16 vCPU / 48 GB of ram can also collect up to 12000 Objects.

***Reference VMware KB - https://kb.vmware.com/kb/2130551

SIZING SCENARIO:

Now imagine a scenario, where you have a 4 Medium Node cluster with 4 node in Site A. You have a vCenter Adapter instance which has more than 7000 Objects (5000 VMs, 2000 Datastores, 200 ESXI Hosts etc). In such a situation, in order to collect data from this vCenter Adapter instance, you would have to up size your cluster node to a large node. Since vROps cluster nodes have to be symmetrical, you would have to up-size all your cluster nodes to LARGE NODES. In this situation you would have to invest on 32 vCPU (8 per cluster node to reach 16 vCPUs) and 64 GB of RAM (16 per node to reach 48 GB per cluster node). This in most cases is a huge change since you would have to ensure you have enough resources in the under lying cluster. In some cases you might also go beyond the NUMA boundary which we all know has some performance impact from a CPU standpoint.

With all these concerns in place, it would an excellent opportunity to leverage the Remote Collectors in the local Site A as well. While the name says REMOTE, it is not necessary that remote collectors are deployed only on remote sites. They can also be utilized in a local site to collect data from adapter instances which can be large in size. Taken our example into consideration, we would just need 2 Remote Collectors ( 2 for high availability, in case one fails) to collect from the Site A vCenter. These 2 appliances will only cost as 8 vCPUs and 32 GB of RAM in total). This will reduce the resource requirements by more than half and also ensure that your cluster nodes have no pressure on collector and hence all that CPU and RAM can be utilized by the other roles on the vROps nodes which will eventually give better performance.

So here would be the new architecture with Remote Collectors Everywhere!!!


With this model, we have better performance, more scale and less hardware requirement for deploying large vROps Deployments. Another important thing to note is that you can always migrate from Design 1 to Design 2 or from Design 2 to Design 1 without any downtime or data loss. Hence if you are on the way to scale the environments being monitored by vROps, this tech tip would be very useful for you.


Hope this helps with day to day datacenter operations using vRealize Operations Manager.


Stay tuned for more goodies!


Sunday, October 2, 2016

Did You Know #1 - Controlling Alerts Storms During Maintenance with vROps!

Welcome to a new series of "Did You Know" Facts about vRealize Operations Manager! With this series, I will help unearth the Best Kept Secrets of vRealize Operations Manager. 

This could be across, features, functionalities, use cases, integrations, APIs or any tips or tricks which can help make day to day operations of Software Defined Datacenter easier and fun with vRealize Operations Manager!

In this first part of the series, we will look at a generic activity of maintenance which is applicable to every datacenter. In most environments activities like patching, power cycle, upgrades, hardware replacements etc are conducted during change windows. While all these activities are important, it is also important that you use the Maintenance Schedules or Maintenance options on vRealize Operations manager to disable any activity on objects which are under any kind of maintenance. This will help you ensure that you do not trigger any FALSE alerts which you might have configured on that object type.

For instance, if you have an alert which would trigger when a virtual machine is powered off, you should ensure that you put virtual machines in maintenance if you are planning to shut them down due to a scheduled downtime for activities such as patching, migrations, hardware version upgrades etc.

To do this follow the steps mentioned below. Do note that you should be on vROps 6.x or above to make use of these steps:

The GUI way:

1- Login to vRealize Operations Manager instance using credentials with permission to perform maintenance activities. Use admin if you do not have a strict Role Based Access Control (RBAC)

2- Click on Administration -> Inventory Explorer

3- On the top right corner of this page, search for the Object which you want to put in maintenance, in my case I want to upgrade my SQL server from SQL 2008 to SQL 2012, hence I will search for this VM.


4- Once I see the Virtual Machine in the List, I just need to select the same and click on the Maintenance Icon:


5- You will see pop-up which you can use to enter the details of maintenance window on this object. You have the option of either entering the maintenance in minutes or an end date.


That's it. This will ensure that the concerned object is in maintenance and I will not get any alerts for the same when I reboot.

In case you choose the first option to end the maintenance manually, please ensure that you do the same, as soon as you are done with the change you were implementing. You would need to come back to inventory explorer, search for the Virtual Machine, select the Virtual Machine name, and click on End Maintenance as shown below:


The API way:

For the cool kids out there, you can also do this programatically by using the vRealize Operations Manager API. Here are the API details, along with JSON and XML sample requests which can be used to build a script or a workflow and you can put one or multiple Objects into maintenance easily. You can use the API calls to end the maintenance as well.

To access the API documentation, you will need to access the following URL:

https://<your-vrops-ip-or-fqdn?>/suite-api/docs/rest/index.html


Hope this helps with day to day datacenter operations using vRealize Operations Manager.


Stay tuned for more goodies!


Monday, May 2, 2016

Top vBlog 2016 - Time to Choose the Top Blogs in the Virtualization Space!


Eric Siebert just opened the Top vBlog 2016 voting on vSphere-Land. Like every year, it is important that we vote the best in business to keep the bloggers motivated. So let's pay back from the community to the bloggers by showing some love for their content and efforts.


Like every year, vXpress is nominated for voting as well. If you have liked the work I have done in the past year and it has helped you in learning new things then your vote would be appreciated. 

It is a democratic process and hence I would not share the list of people I have voted for as this might influence your decision ;-)

Here are a few things to keep in mind while voting. (Copying from Eric's post)

  • Longevity – Anyone can start a blog but it requires dedication, time & effort to keep it going. Some bloggers start a blog only to have it fall to the wayside several months later. Things always come up in life but the good bloggers keep going regardless of what is happening in their life.

  • Length – It’s easy to make a quick blog post without much content, nothing wrong with this as long as you have good content in the post that people will enjoy. But some bloggers post pretty long detailed posts which takes a lot of time and effort to produce. The tip of the hat goes to these guys that burn the midnight oil trying to get you some great detailed information.

  • Frequency – Some bloggers post several times a week which provides readers with lots of content. This requires a lot of effort as bloggers have to come up with more content ideas to write about. Frequency ties into length, some do high frequency/low length, some do low frequency/high length, some do both. They’re all good and require a lot of time and effort on the bloggers part.

  • Quality – It all comes down to whats in the blog post regardless of how often or how long the blog posts are. After reading a blog post if you come away with learning something that you did not previously know and it benefits you in some way then you know you are reading a quality post. Good quality is usually the result of original content, its easy to re-hash something previously published elsewhere, the good bloggers come up with unique content or put their own unique spin on popular topics.


Here is the LINK TO VOTE


A special thanks to Eric for the efforts he puts in this activity and of-course the sponsors who support the community bloggers with their sponsorship for this event.


Saturday, February 27, 2016

Session Timeout for vRealize Operations NOC Dashboard!


Photo Credit - http://indianatelephonenetwork.com/support/network-outages/ 

Just wanted to share something which I recently learnt about the vROps dashboards and session timeouts for a user. We all know that with vRealize Operations Manager you can use the session timeout feature under Administration -> Global Settings, to control the session timeouts for users. While the default option for this timeout is 30 minutes, the maximum you can go up to is 34560 minutes which is around 22 days. Here is the screenshot from the settings page:-


The product does not give you the option for disabling the session timeouts completely as it did in it's previous avatar : vCOps 5.x. The reason you would not want to disable the session timeout is to ensure that you do not run out of sessions, since each vROps node can provide only a limited number of sessions.

If this is the case, how can you have a dashboard for your NOC monitors which does not timeout?

Actually the answer is pretty simple, if you have a dashboard which contains a widget which refreshes every few minutes, or basically if the refresh period is less than 30 minutes, then you will not be timed out. So make sure that you have a widget which keeps refreshing the session alive.

Also, I would recommend that you use Firefox as I have seen one of my customer test it in their NOC and the NOC user did not timeout.


Share & Spread the Knowledge!!


Sunday, September 6, 2015

Guest Post : vRealize Operations Manager Metric Guide!


************Updated with vROps 6.6. Statkeys on 8th January 2018**************

I would like to thank my great friend Sunny Dua for giving me the opportunity to be his guest blogger.

I came across many requests both internally (field consultants / SE) and externally (Clients) for an extensive list of available metrics of vRealize Operations Manager in the form of sheet, so that one can easily refer to without accessing the product UI. The request was genuine, as vROps has rich library of metrics which can be leveraged for doing performance and capacity analysis and creating super-metrics, views, dashboards. I started looking through various available documents and internal sources, but couldn’t find any. Now in the same process, I found a wonderful stuff which is REST interface for vROps. Now coming from an Automation background, I really like to play with api’s and use them to automate as much as possible.


Now, let’s deep-dive into, how I have extracted these metrics.


vRealize Operations API documentation can be found at https://IPADDRESS OF vROPs/ suite-api/docs/rest/index.html. In this page, you can find all relevant information like, which API’s are available, sample request and response etc. The REST call that I made to retrieve these metric details is

That’s it. Is it the end of the Blog? Nope, because I know, you would be wondering, how did I get to this request, or how do I know which API call I need to fire, Right?

So, let me explain this. The first thing that we do, whenever we want to see any Metric, is we always select the Adapter Type first in GUI interface. So select the “getAdapterTypes”. The request now becomes.


Now, fire the above request on web browser.  Here is what you will see.


So, now we know that the adapter-kind key is VMWARE. So the call now becomes

Again, let’s see what we get after executing above request. 


So, now we see all the Object Types available under VMWARE. Note down the resourceKinds key for the Object you want to retrieve metrics. Request now becomes

Execute the request and you see.


That’s it. Here you get the complete http request for getting the statkeys:

Now, fire the above commands one by one replacing the resourceKinds with each object available under the VMWARE adapterkind. Once you have all the data, it’s quite easy to then dump them into XLS format.

Hope this consolidated sheet helps you and becomes your reference tool. I have also uploaded this on the following link and you can get a copy. However it is always good to know how I created this as you can do the same for any other AdapterKind.


- This is a Guest Post by Sourabh Shrivastava.


Updated with vROps 6.6. Statkeys on 8th January 2018