Showing posts with label VSAN. Show all posts

Friday, August 2, 2019

Key vSAN metrics and properties available in vRealize Operations

vSAN day 2 operations are increasingly becoming mainstream in vRealize Operations. With the last release of vRealize Operations 7.5, while vROps added some cool capabilities around workload balancing using workload optimization across multiple vSAN clusters, there were some key metrics which were added to help vSAN administrators.

Some of the key metrics that are available today from a performance point of view :


Some of the key metrics which you can now notice include average I/O size which can be now measured to understand what I/Os are hitting the vSAN clusters and whether they are unexpected from the initial design.


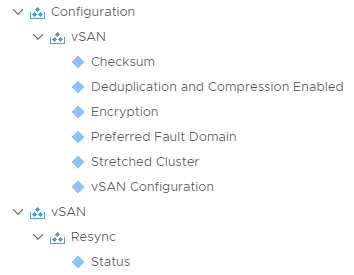
Similar to metrics, here are some key properties which will help you understand the manage the configuration of your vSAN environments:


Monday, June 26, 2017

Part 5 - Performance Troubleshooting Dashboards in vRealize Operations 6.6.

Hope you are enjoying the What's New with vROps 6.6 Series. I am having a great time writing this, since my experience as a user of vROps has completely turned around with this release. In this post, we will continue talking about the rich & use case driven out of the box content available in the form of dashboards.

The Getting Started page in the product acts an anchor for showcasing all the use cases. The focus of this post would be on Performance Troubleshooting.

Here is how Performance Troubleshooting shows up on the Getting Started Page:


The Performance Troubleshooting category caters to the administrators responsible for managing the performance & availability of the virtual machines running in the virtual infrastructure. This category runs your through a guided workflow to answer questions which will help you with the troubleshooting process. The dashboards in this category identify and isolate problems that may impact your applications. They provide a line of sight into the full stack to isolate and identify the root cause quickly.


Key questions these dashboards help you answer are :

Is application performance impacted due to virtual infrastructure?

Are noisy neighbors impacting multiple virtual machines and corresponding applications?

Are there active alerts which require action?

Any known issues impacting the performance & availability of a vSAN cluster?


Let us look at each of these dashboard and I will provide a summary of what these dashboards can do for you along with a quick view of the dashboard:


Troubleshoot a VM

The Troubleshoot a VM dashboard helps a VI Administrator to deal with day to day troubleshooting of issues in a virtual infrastructure. While most of the IT issues in an organization are reported at the application layer, this dashboard provides a guided workflow which can help investigate an ongoing or a suspected issue with virtual machines supporting the impacted applications.

You can easily search for a virtual machine by its name or can sort the list of VMs with active alerts on them to start your troubleshooting process. As soon as you select a VM, you can view its key properties to ensure they are configured as per your virtual infrastructure design. Any deviation from standards could cause potential issues. You can view any known alerts, the workload trend of the VM over the past week and if any of the resources serving the virtual machine has any ongoing issue.

The next step in the troubleshooting process allows you to eliminate the major symptoms which might impact the performance or availability of a virtual machine. You can drill down further into the key metrics to find out if the VMs utilization patterns are abnormal or it is contending for basic resources such as CPU, Memory or Disk.


Troubleshoot a Cluster

The Troubleshoot a Cluster Dashboard provides you a guided workflow to identify issues and isolate them easily. You can either start with a cluster which happens to have an issue by using the search option or you can simply sort your clusters with the number of active alerts on them.

On selecting a specific cluster you want to work with, you can see a quick summary of number of hosts participating in that cluster and the VMs being served by them. The dashboard provides you the current and past utilization trends of how hard your cluster is working and what are the known problems on the cluster in form of alerts.

You can easily view the hierarchy of objects related to the cluster and review their status to identify if they are impacted due to the current health of the cluster. You can quickly identify any contention issues by looking at the max and avg. contention faced by the virtual machines on the selected cluster. The dashboard allows you to drill down to specific virtual machines which might be a victim of resource contention and take your next steps in the troubleshooting process to cater to those victims and avoid issues proactively. 


Troubleshoot a Datastore

Troubleshoot a Datastore dashboard helps provide a guided workload to an administrator in order to quickly identify storage issues and act on them. Based on your troubleshooting style you can either start with a Datastore which might be in trouble due to high latency and is showing red on the heatmap or you can search for a Datastore which you have in mind. You can also sort all the datastores with active alerts and start working your way with a Datastore with known problems.

On selecting a datastore you see its current capacity and utilization along with a count of VMs served by that Datastore. The metric charts helps you to view historical trends of key storage metrics such as latency, outstanding IOs and throughput.

The dashboard also lists the virtual machines served by the selected datastore and help you analyze the utilization and performance trends of those virtual machines. If the virtual machines are suffering, the VI administrator can migrate these virtual machines over to other datastores to evenly spread out IO load.


Troubleshoot a Host

Since ESXi servers are the main source of providing resources to a virtual machine, they become extremely critical when it comes to performance and availability. With Troubleshoot a host dashboard, you can either search for specific Host which you have in mind or sort the hosts with active alerts to start your investigation.

As soon as you select a host, you can see the key properties of each of the host to ensure thy are configured as per your virtual infrastructure design. Any deviation from standards could cause potential issues. You can answer some key questions around current and past utilization, workload trends over the last week and if virtual machines served by the host are healthy.

Hardware faults with the hosts can be easily surfaced on this dashboard since it lists all the critical events which might affect the availability of the hosts. If you find a host which is running hot, the next logical step in the troubleshooting process would be to find out the villain virtual machines which might be consuming resources from that host. You can find a list of top 10 virtual machines which are demanding CPU and Memory Resources from the identified host.


Troubleshoot vSAN

The Troubleshoot vSAN dashboard is designed to help a vSAN administrator step through a guided workflow to investigate potential issues with each layer of vSAN. The dashboard allows you to start with looking at key properties of your vSAN cluster along with the active alerts on any of the cluster components such as hosts, disk groups or the vSAN datastores.

Once you select a cluster, you can list all the known problems with all the objects which are associated to that cluster. This includes, clusters, datastores, disk groups, physical disks and most importantly the virtual machines which are being served by the selected vSAN cluster.

The dashboard then drills down into the key utilization and performance metrics and shows you a trend of how the cluster has been used and has performed over the past 24 hours. You can easily go back in time if you are dealing with historical issues. While most of the problems would be surfaced up at the cluster level, a drill down analysis can be done at the host, disk group or down to the physical disk level.

Heatmaps within the dashboard help you answer questions around write buffer usage, cache hit ratio, host configurations and physical issues with capacity and cache disks such as drive wearout, drive temperature and read-write errors.


 Troubleshoot with Logs

The Troubleshoot with Logs dashboard can be used when you want to investigate an ongoing issue within your virtual infrastructure using the logs. This dashboard helps you to look at predefined views created within Log Insight to answer common questions which can be surfaced through pre-defined queries within Log insight.

With this dashboard, you can correlate metrics and queries within vRealize Operations Manager on a single pane of glass to troubleshoot issues across applications and infrastructure.


In case you are like me, and don't like to READ. You can see the dashboards in action in this video playlist:

See all dashboards in action here.


More to come.. Stay Tuned!!


Monday, June 19, 2017

Part 3 - Operations Dashboards in vRealize Operations 6.6.

In my last post I gave you an overview of the new user interface of vRealize Operations 6.6 along with some other important enhancements. Do go through that post to get a context of what we are going to discuss here.

With the introduction of Getting Started page within dashboards, one of the categories which is available out of the box is called the "Operations".

Here is how operations shows up on the Getting Started Page:


The Operations category is most suitable for roles within an organization who require a summary of important data points to take quick decisions. This could be a member of a NOC team who wants to quickly identify issues and take actions, or executives who want a quick overview of their environments to keep a track of important KPIs.

Key questions these dashboards help you answer are :
  • What does the infrastructure inventory look like?
  • What is the alert volume trend in the environment?
  • Are virtual machines being served well?
  • Are there hot-spots in the datacenter I need to worry about?
  • What does the vSAN environment look like and are their optimization opportunities by migrating VMs to vSAN?

Let us look at each of these dashboard and I will provide a summary of what these dashboards can do for you along with a quick view of the dashboard.

Datastore Usage Overview


The Datastore Usage Dashboard is suitable for a NOC environment. The dashboard provides a quick glimpse of all the virtual machines in your environment using a heatmap. Each virtual machine is represented by a box on the heatmap. Using this dashboard, a NOC administrator can quickly identify virtual machines which are generating high IOPS since the boxes representing the virtual machine are sized by the number of IOPS they are generating.


Along with the storage demand, the color of the boxes represents the latency experienced by these virtual machines from the underlying storage. A NOC administrator can take the next steps in his investigation to find the root cause of this latency and resolve it to avoid potential performance issues. 


Host Usage Overview


The Host Usage Dashboard is suitable for a NOC environment. The dashboard provides a quick glimpse of all the ESXi hosts in your environment using a heatmap. Using this dashboard the NOC administrator can easily find resource bottlenecks in your environment created due to high Memory Demand, Memory Consumption or CPU Demand.


Since the hosts in the heatmap are grouped by clusters, you can easily find out if you have clusters with high CPU or Memory Load. It can also help you to identify if you have ESXi hosts with the clusters which are not evenly utilized and hence an admin can trigger activities such as workload balance or enable DRS to ensure that hotspots are eliminated.


Operations Overview


The Operations Overview dashboard provides a high level view of objects which make up you virtual environment. It provides you an aggregate view of virtual machine growth trends across your different datacenters being monitored by vRealize Operations Manager.

The dashboard also provides a list of all your datacenters along with inventory information about how many clusters, hosts and virtual machines you are running in each of your datacenters. By selecting a particular datacenter you can zoom into the areas of availability and performance. The dashboard provides a trend of known issues in each of your datacenters based on the alerts which have triggered in the past.

Along with the overall health of your environment, the dashboard also allows you to zoom in at the Virtual Machine level and list out the top 15 virtual machines in the selected datacenter which might be contending for resources.


Optimize vSAN Deployments


The Optimize vSAN deployments dashboard is an easy way to device a migration strategy to move virtual machines from your existing storage to your newly deployed vSAN storage. The dashboard provides you with an ability to select your non vSAN datastores which might be struggling to serve the virtual machine IO demand. By selecting the VMs on a given datastore, you can easily identify the historical IO demand and latency trends of a given virtual machine.

You can then find a suitable vSAN datastore which has the space and the performance characteristics to serve the demand of this VM. With a simple move operation within vRealize Operations Manager, you can move the virtual machine from the existing non vSAN datastore to the vSAN datastore.

Once the VM is moved, you can continue to watch the utilization patterns to see how the VM is being served by vSAN.


vSAN Operations Overview


The vSAN Operations Overview Dashboard provides an aggregated view of health and performance of your vSAN clusters. While you can get a holistic view of your vSAN environment and what components make up that environment, you can also see the growth trend of virtual machines which are being served by vSAN.

The goal of this dashboard is to help understand the utilization and performance patterns for each of your vSAN clusters by simply selecting one from the provided list. VSAN properties such as Hybrid or All Flash, Dedupe & Compression or a Stretched vSAN cluster can be easily tracked through this dashboard.

Along with the current state, the dashboard also provides you a historic view of performance, utilization, growth trends and events related to vSAN.


In case you are like me, and don't like to READ. You can see the dashboards in action in this video playlist:

See all dashboards in action here.


More to come.. Stay Tuned!!


Tuesday, January 3, 2017

Enabling SDDC Health Solution for VSAN monitoring.


A few days back, I wrote about the release of VMware SDDC health Solution 2.0 which enabled you to monitor all the key components of your Software Defined Datacenter. If you go though the documentation of this release, you will see that the pre-requisite to monitor VSAN through this management pack requires you to install and configure the VMware vRealize® Operations Management Pack for vSAN™. This can be downloaded from the following link.
Share & Spread the Knowledge!!


Once you have the SDDC Health Solution and the VSAN management pack configured, you would need to enable the VSAN monitoring for VSAN to show as a child of SDDC solution on vROps UI. This option is not enabled out of the box since you may or may not have VSAN in your SDDC environments.

To enable this option follow the steps below:


Enable VMware vSAN Health Monitoring

VMware vSAN health monitoring under SDDC Health Management solution is disabled by default. You can manually enable the instance to receive VMware vSAN alerts and turn on the collection for VMware vSAN to collect data.

Note vRealize Operations Management Pack for vSAN is only supported on vRealize Operations Manager 6.4 and later.

Prerequisites

Verify that vRealize Operations Management Pack for vSAN is installed to monitor VMware vSAN health using SDDC Health Management Solution.

Procedure

1- Log in to the vRealize Operations Manager CLI using the root user and change the VSAN property to true in the sddchealth.properties file.

2- Edit the sddchealth.properties in the vi editor and set the value to true.

# vi $ALIVE_BASE/user/plugins/inbound/SDDCHealthAdapter3/conf/sddchealth.properties


3- Stop and restart the collection for SDDC Health adapter. 


Once you are done, you will start seeing the VSAN icon under the SDDC Management Health Overview Dashboard.


Will share as I explore this further in monitoring the entire gamut of SDDC solution with the aim of getting them under a "Single Pane of Glass" :-)


Share & Spread the Knowledge!!