Monday, October 28, 2019

vRealize Operations dashboards to monitor VMware Cloud on AWS

I have seen a number of asks for dashboards that can help with monitoring specific use cases related to VMware Cloud on AWS. With this post, I will share four such dashboards that I have been working on pertaining to VMC monitoring use cases. Special thanks to William Lam for guiding me with the best practices related to VMC monitoring. All those best practices were considered while creating these dashboards.

Along with the description and usage if these dashboards, this post will also provide the pre-requisites and few simple steps to import these dashboards in your environment.


About the dashboards

Once imported you will see the following four dashboards under a new dashboard group named "VMC Dashboards".


VMC Capacity Dashboard

Purpose

This dashboard provides a capacity overview of each of your VMC SDDC. You can easily drill down into the capacity of all the underlying components such as Clusters, Hosts, VMs, Datastores, and Diskgroups.

How to use this dashboard?
  • The first 3 rows show you a card per VMC SDDC with 3 different dimensions. This includes Capacity Remaining, Time Remaining and VM Remaining.
  • Upon selecting an SDDC, you can see the clusters, hosts, VMs (both management and workload), datastores and disk groups. 
  • The key KPIs are color-coded to help identify capacity bottlenecks.


VMC Inventory Dashboard

Purpose
This dashboard provides a quick overview of inventory of all your VMC SDDCs. The inventory includes:
  • vSphere Clusters
  • Datastores
  • Hosts
  • Virtual Machines
How to use this dashboard?
  • The first row shows you a card per VMC SDDC with number of virtual machines running in each SDDC. This also shows you a trend of virtual machine growth over the past 30 days.
  • Once you are close to the number of VMs supported per SDDC, the card will indicate that by changing colors.
  • Upon selecting a card, you can see the list of all the vSphere Clusters, Datastores, vSphere Hosts and VMs in that SDDC with key configuration details.
  • You can choose to export the desired list in a CSV format using the toolbars on the list.
  • You can also filter the list of vSphere Hosts and VMs by selecting a vSphere Cluster or list of VMs by selecting a vSphere Host.


VMC Management VM Dashboard

Purpose


This dashboard helps you monitor the utilization and performance of the key management VMs running in your SDDC. The goal of this dashboard is to ensure that the management components such as vCenter and NSX are not facing any resource bottleneck from a CPU, Memory, Network and Storage perspective.

How to use this dashboard?

  • The first list provides all the management components in each SDDC with key CPU utilization and performance KPIs. Upon selecting a management VM, you can see the usage and performance trends of all the CPU cores.
  • The second list provides all the management components in each SDDC with key Memory utilization and performance KPIs. Upon selecting a management VM, you can see the memory usage and performance trends.
  • The third list provides all the management components in each SDDC with key Network utilization and performance KPIs. Upon selecting a management VM, you can see the network usage and performance trends.
  • The fourth list provides all the management components in each SDDC with key Storage utilization and performance KPIs. Upon selecting a management VM, you can see the storage usage and performance trends.


VMC Utilization and Performance Dashboard
Purpose

This dashboard provides a utilization and performance overview of each SDDC based on heavy hitter VMs and impacted VMs over the last 30 days of utilization and performance KPIs


How to use this dashboard?

  • The first list shows the list of all the SDDC with aggregate CPU, Memory ad Storage utilization over the last 30 days with Maximum and 95th Percentile values.
  • Upon selecting an SDDC, you can see the list of top virtual machines which are consuming Compute, Network & Storage resources in each SDDC.
  • The dashboard has 2 sections thereafter. One shows the Compute (CPU & Memory) utilization and performance analysis and the second shows the Network and Storage utilization and performance analysis.
  • Each section is based on the last 30 days of data with 95th percentile transformation which is configurable as needed to Max, Average, Current, Standard Deviation or other mathematical transformations.
  • This data helps you find the victims and villains in your environment which are negatively impacting capacity or performance from a CPU, Memory, Storage or Network perspective.


Pre-requisites

The following pre-requisites should be taken care of before importing these dashboards.
  • These dashboards need either vRealize Operations version 7.5 or 8.0.
  • These dashboards are tested with VMC SDDC version 1.7 and above.
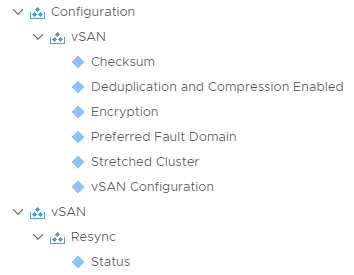
  • Both vCenter and vSAN adapter instances should be configured.
  • Need vRealize Operations Advanced edition or above.
  • Need appropriate vRealize Operations permissions to import and share.

Steps to import

1- Ensure that your VMC vCenters instances are configured with Cloud Type as "VMware Cloud on AWS". More details here.

2- Download this VMC Dashboard Content.zip file and extract it to your desktop.


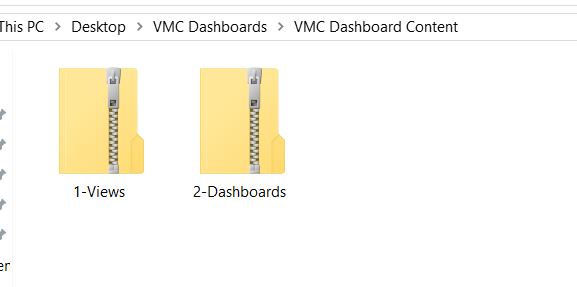
3- Import 1-Views.zip file to your vROps instance. Click on Dashboards - Views - Actions - Import Views

4- Import 2-Dashboards.zip file to your vROps instance.  Click on Dashboards - Actions - Manage Dashboards - Action - Import Dashboards.

You should have your dashboards by now. Please note that these dashboards might take a few seconds to load for the first time. 

Hope this article helps you. Please share your comments in the comments section below or follow me on twitter to be updated on similar content - @sunny_dua.


Friday, October 18, 2019

Everything you need to know about the vRealize Operations 8.0 release

The wait is over. vRealize Operations 8.0 is NOW Available. Here are my prescribed next steps:


4- Ensure to run the Upgrade Assessment Tool, available on the download page:


      5- Check the compatibility with management packs you might have in your environment - https://www.vmware.com/resources/compatibility/search.php?deviceCategory=vrops
    
      6- Check product compatibility matrix (just in case) - https://www.vmware.com/resources/compatibility/sim/interop_matrix.php

      7- Good news – Most of the VMware solution packs that go with vROps are already released and here are the links:


Solution Name
Release Notes & Download Link
vRealize Operations Management Pack for CloudHealth by VMware
vRealize Operations Management Pack for Storage Devices
vRealize Operations Management Pack for VMware Cloud on AWS
vRealize Operations Management Pack for NSX-T
vRealize Operations Management Pack for vCloud Director
vRealize Operations Management Pack for Skyline
vRealize Operations Management Pack for Container Monitoring
SDDC Health Monitoring Solution
vRealize Operations Management Pack for NSX for vSphere
vRealize Operations Management Pack for vRealize Orchestrator
vRealize Operations Management Pack for VMware Identity Manager
vRealize Operations Federation Management Pack
vRealize Operations Management Pack for VMware Integrated OpenStack
vRealize Operations Management Pack for Cloud Provider Pod


Happy Installing/Upgrading.

Hope this article helps you. Please share your comments in the comments section below or follow me on twitter to be updated on similar content - @sunny_dua.


Tuesday, October 8, 2019

Leveraging "Cloud Type" to configure VMware Cloud vCenter in vRealize Operations

With this post, I wanted to share a quick tip which one should follow while adding a vCenter Server running in VMware Cloud on AWS. With vRealize Operations, you can simply point to a VMC based vCenter and gather both vCenter and vSAN metrics from a VMC vCenter.

While adding the endpoint is an extremely simple task in vROps, for VMC, currently, you have to take an extra step to ensure that the vCenter is recognized as a VMC vCenter. This additional setting is called the Cloud Type advanced setting. This setting is available in vRealize Operations 7.0 and above. In vROps 8.0 though this setting would be under a new feature called Cloud Accounts.

With vRealize Operations 8.0 which has been announced at VMworld US 2019, one of the key features which would help you to easily configure endpoints to monitor such as vCenter, AWS or Azure is Cloud Accounts.

Cloud Accounts are a common construct between vRealize Operations 8.0 and vRealize Automation 8.0 as well, which means if you have configured endpoints for provisioning in vRA 8.0, they would automatically be available to import inside vROps 8.0, given vRA and vROps are integrated. More on this would come out in blogs and documentation as the products are GA'ed.

Well, coming back to how we could configure a VMC vCenter cloud account. Here are the steps:

1- Login to vROps with a user with appropriate privileges to create a cloud account / Adapter instance.

2- Click on Administration -> Cloud Accounts

(Note for versions prior to vROps 8.0, the correct path would be Administration -> Solutions. You will select the vCenter Solution and edit the same to add an adapter instance. The rest of the steps remain the same. See this documentation link for more details)

3- Click on Add Account


4- Select vCenter 


5- Fill in the details of your vCenter as shown below, and then click on Advanced Settings as shown below.


6- Under Advanced Setting, you would notice an option called Cloud Type


7- For Cloud Type, the default option is "Private Cloud". This is to be chosen when you are running your vCenter on-prem and you are managing it. "Hosted Private Cloud", when a service provider is hosting your vCenter and "VMware Cloud" option when VMware is managing your vCenter.

Select VMware Cloud on AWS


8- If you are running vROps 7.5 or prior, you will save this adapter configuration and then configure the vSAN adapter to collect data from vSAN in VMC. However with vROps 8.0, this is a simple one click enable option within vCenter Cloud Account.

9- Once you have chosen the Cloud Type, click on the vSAN Tab as shown below and enable vSAN monitoring by using the toggle button.


10- You may click on Test Connection or just click on Add to save the Cloud Account and create the required adapter instances to start the collection.


Choosing the right cloud type is important to ensure that vROps understand the vCenter endpoint and apply the correct business logic for use cases such as compliance, costing and monitoring.

I hope this helps... More to come on vRealize Operations 8.0 as it gets ready for a General Availability...

Please share your comments in the comments section below or follow me on twitter to be updated on similar content - @sunny_dua.


Friday, October 4, 2019

Copy and paste widgets from your favorite dashboards in vRealize Operations

While creating custom dashboards in vRealize Operations, there are times when you want to use the same widget type to be re-used within a dashboard multiple times. At the same time, you might want to re-use some of the widgets which you might like in the out of box dashboards and want to leverage the same to create your own dashboards.

In the past, you would do this by going through a lot of steps to literally recreate the entire widget and configure it to the tee. Depending upon the complexity of the customization, this could take from minutes to hours, especially if you are working on creating a dashboard with a number of widgets.

How cool it would be if you can just copy your favorite widgets from a pre-existing dashboard or configure once and replicate a widget multiple times within the same dashboard just by using simple copy and paste functions... 

Before vRealize Operations 7.5, this sounded like a BEAUTIFUL DREAM 😂

With vRealize Operations 7.5, we introduced a gem of functionality which in my humble opinion was lost in the huge list of amazing new features that came out with this release. The "What's New" section of release notes seems to be 4 pages long.

Within the release notes, you will notice a feature related to Dashboards and Widget Enhancements which talks about the functionality of copying and pasting widgets. Here is a screenshot from the release notes...


Feature Details:

As the release note mention, this capability allows you to pick up any dashboard, edit the dashboard and then select widgets within that dashboard by clicking through them, just like how you would select photos from a folder. You can select one or multiple widgets at the same time. Once selected, just use the CTRL+C on your keyboard or use the Actions menu to copy the widgets.

Once copied, you can open a new dashboard canvas in the same or a different browser session and then past the copied widget using CTRL+V or Actions -> Paste from the menu.

You would just need to redo interactions if any, else everything else will be pre-configured based on the base widget. This includes both widgets and views. Yes, you read it right.


Let's have a quick look at how this works:


Here is my favorite Capacity Utilization dashboard. I like some of the widgets in this dashboard which would take hours to configure manually. Let me just edit the dashboard and copy what I like into a new dashboard.

1- Launch the source dashboard you want to copy widgets.

2- Click on Actions -> Edit Dashboard


3- Select the widgets you want to copy. Notice how they are highlighted with a blue outline as I select them.


4- Click on the actions button as indicated below to select Copy Widgets(s) or use the keyboard shortcut for copy.


5- Now you can cancel out of this dashboard as the copy is done.

6- Click on the Actions Menu under dashboards and click on Create Dashboard.

7- Once the new dashboard canvas opens, click on Actions -> Past Widget(s)


Just like that.. It's done in seconds. Saving you a number of hours and getting you to your goal of getting that perfect dashboard you always wanted 😃😃😃

From this point onwards, you can make the delta changes you need in your target dashboard and setup any interactions if applicable and you are good to go..

To find some cool dashboards you might want to copy from, explore the vRealize Operations community created dashboard repository on VMware Code.

Hope this article helps you. Please share your comments in the comments section below or follow me on twitter to be updated on similar content - @sunny_dua.


Friday, August 2, 2019

Key vSAN metrics and properties available in vRealize Operations

vSAN day 2 operations are increasingly becoming mainstream in vRealize Operations. With the last release of vRealize Operations 7.5, while vROps added some cool capabilities around workload balancing using workload optimization across multiple vSAN clusters, there were some key metrics which were added to help vSAN administrators.

Some of the key metrics that are available today from a performance point of view :


Some of the key metrics which you can now notice include average I/O size which can be now measured to understand what I/Os are hitting the vSAN clusters and whether they are unexpected from the initial design.


Similar to metrics, here are some key properties which will help you understand the manage the configuration of your vSAN environments:


Saturday, May 11, 2019

Operate VMware Cloud on AWS using vRealize Operations

VMware Cloud on AWS is one of the most talked about innovations and partnerships between VMware and AWS Cloud. With VMware’s SDDC stack fully deployed on AWS, we are delivering on the promise to VMware customers to get the economies of the public cloud without re-writing your existing applications.  While talking to most of the customers who are leveraging VMware Cloud on AWS today, the biggest value which they often speak about beyond the benefit of “zero app re-platforming” is about the seamless integration of a public cloud platform like AWS into their existing processes and toolsets.
Almost all of these customers were leveraging vRealize Operations to manage their on-premises SDDC, and find it extremely simple to add their VMware Cloud on AWS vCenter into vRealize Operations and extend the current set of monitoring, troubleshooting, optimization, and remediation processes to VMware Cloud on AWS.  This provides such customers a view of their hybrid environment within minutes and with zero impact on their people or processes.  With this post, I will show you how simple it is to bring in a VMware Cloud on AWS deployments into your existing on-premises vRealize Operations Cluster.
Before we get into the how, let us quickly look into a couple of architectural options you have while connecting your VMware Cloud on AWS vCenter to your on-premises vRealize Operations.  I will also provide you architectural options if you want to deploy vRealize Operations on VMware Cloud on AWS.
Architecture Option 1 – vRealize Operations On-Premises
Architecture Option 2 – vRealize Operations Running on VMware Cloud on AWS
Architecture Option 3 – vRealize Operations Federation with VMware Cloud on AWS
  • Provide a summary of performance, capacity, and configuration to Senior Executives and Virtual Infrastructure Administrators across all your vSphere environments.
  • Provide a unified view of events triggered across the virtual environments into a single pane for making it easier for NOC or Helpdesk to initiate action.
  • Ability to create a data warehouse where a user-selected set of metrics can be stored for data archiving and report use cases.
  • Ability to provide summarized views of health and configuration of your SDDC stack.  This includes core applications such as VMware vCenter Server, VMware NSX, and VMware vSAN.
  • The solution also covers the management applications such as vRealize Operations Manager, vRealize Log Insight, vRealize Automation, vRealize Business, and VMware Site Recovery Manager.

With this option, the assumption is that you have a large part of your infrastructure on-premises including vCenter, ESXi hosts and other hardware and applications which you are monitoring with vRealize Operations. At the same time, you have on-boarded to VMware Cloud on AWS and have recently provisioned a couple of SDDCs therein and as a result of which you have some vCenter footprint in VMware Cloud on AWS.
In this model, you can extend the existing operational capabilities of vRealize Operations to the VMware Cloud on AWS vCenter, by simply connecting the vCenter as an end-point inside vRealize Operations. You create an adapter instance both for vCenter Server and vSAN to collect data from vCenter and bring that into vRealize Operations Manager. You can do this by either directly connecting the vCenter or leveraging a remote collector which can be deployed inside a VMware Cloud on AWS SDDC to ensure that the data can be compressed and encrypted.
The existing vRealize Operations cluster would need to be scaled out to incorporate the new VMware Cloud on AWS SDDC sites which you plan to monitor. In order to get the appropriate sizing, you can leverage the vRealize Operations Online Sizer Tool.
The diagrams below show both the options discussed above:

vRealize Operations on-premises collecting data from VMware Cloud on AWS and native AWS directly


vRealize Operations on-premises collecting data from VMware Cloud on AWS and native AWS with remote collectors


This second option applies to organizations which have moved a large part of their environment into VMware Cloud on AWS. In such a scenario, they can deploy or migrate their vRealize Operations instance in VMware Cloud on AWS directly. The power of VMware Cloud on AWS is that it leverages the world’s most reliable and highly adopted hypervisor, vSphere.  Hence it is trivial to deploy a vRealize Operations cluster there. Once deployed, organizations can collect data from other VMware Cloud on AWS SDDCs using remote collectors. At the same time, for collecting data from an SDDC located on-premises or native AWS, one can deploy remote collectors to send over data into the centralized analytics cluster deployed in VMware Cloud on AWS.
The diagram below illustrates how this architecture would look like:

vRealize Operations in VMware Cloud collecting data from VMware Cloud on AWS, native AWS and on-premises SDDCs with remote collectors


In this third option, you can leverage the federation capabilities of vRealize Operations to federate the data from both on-premises and VMware Cloud on AWS deployed vRealize Operations clusters into a centralized vRealize Operations federation instance for a centralized visibility use case. Some of the powerful use cases of federation are:
Here is an architectural diagram which can be leveraged to deploy a federation solution between on-premises and VMware Cloud on AWS hosted vRealize Operations:

vRealize Operations Federation Deployment between On-Premises and VMware Cloud on AWS hosted vRealize Operations clusters


The above examples will help you decide the best architecture to deliver all Self-Driving Operations with vRealize Operations Manager as you expand into the public cloud with VMware Cloud on AWS.  Maintain your operations people and processes without disruption while you quickly expand into the world of hybrid cloud.  For more technical information on vRealize Operations, visit vrealize.vmware.com for videos, walk-through demonstrations and more.

Note - This post also appeared on VMware Official Blog where I blog as a guest blogger - https://blogs.vmware.com/management/2019/05/vmware-cloud-on-aws-with-vrealize-operations.html

Share and Spread the Knowledge


Monday, March 25, 2019

How to recover vRealize Operations admin account password

With vRealize Operations 7.0, VMware introduced a very simple yet powerful feature which would allow you to reset the built-in admin password of your vRealize Operations instance using recovery settings. I believe this is an extremely useful feature, as I have seen numerous deployments where admins have forgotten the admin password and are forced to login through the root account and run commands to reset the password.

Note - You can follow the procedure mentioned in this KB article to reset a forgotten admin password through SSH.

I would rather use this new feature and keep the password recovery process as simple as possible. Simple in this case provides security as well, since you do not have to share root passwords and run commands.

With vRealize Operations 7.0, once you login to the CASA (Cluster Administration) UI a.k.a. Admin UI, you will find a new section called "Administrator Settings".


This screen allows you to "Change Admin Password". At the same time you can enter the password recovery settings to ensure that in case you lose your admin password, you can use the recovery email to recover the password. In the above example, I have leveraged my SMTP settings to configure this.

Once saved, on subsequent admin login screen, you will notice an option of "Forgot Password"


Once you click on the forgot password option, you will receive an email on the registered recovery account email. Here is how the email will look like:


Upon clicking on the reset password link, you will be redirected to a page where you can reset the admin password.


Once the password is SET, you are good to login with the new password in the subsequent logins.

I think this simple addition would be really helpful with enhancing your operational efficiency. Go ahead and configure the recovery settings on your vROps instances before you forget your admin account password :-)

Share and Spread the knowledge.


Monday, March 18, 2019

Reset out of box content post upgrade or install of vRealize Operations

I have been several times about this and hence I thought I would quickly blog about this. With vRealize Operations, the out of the box content owned by VMware usually gets a refresh with each release. If you wish to get the new updated content, then you can leverage the reset out of box option during upgrade. I wrote about this more than 3 years ago here and this is still relevant.

I have been asked that if one needs to reset the out of box content later on then it is possible. The use cases around this are things like, you have modified out of box symptoms or alerts and you want to restore back to factory settings, or you have accidentally deleted some out of box content which you want to recover.

You can rest out of box content easily per solution. A solution is also known as a management pack which helps you connect to various endpoints to collect data and run analytics.

Here is an example on how you can reset content for vCenter solution:

1- Login with admin privileges or the built-in admin account.

2- Click on Administration -> Solutions.

3- Find the solution for which you want to reset out of box content.

4- Click on the Configure option.

5- On the configuration page click on the option highlighted below to reset out of box content.


6- Read the warning on the dialog box, check the option to confirm and click on ok to take this action.

Note - This process can take up to 30 minutes and will affect the data collection as stated in the warning.


Hope this helps.

Share and spread the knowledge.