Monday, December 7, 2015

The Secret Sauce to be a VMware Ninja!

This is a quick post to share the resources from where I learn about vRealize Operations Manager. In the past few months, I have received a number of questions around Capacity Management, Alerts, Projects etc. I must say that VMware Technical Marketing has done a great job to document all this in a form of short videos which are completely FREE to access. You do not have to register or give out any information as well and just use these resources to learn vRealize Operations Manager.

Here is the Web-link - https://featurewalkthrough.vmware.com

The great news is that feature walk-through is not limited to vROps. You can learn a bunch of stuff about the entire SDDC stack right from vSphere to NSX and everything in between.

Here is a screenshot showcasing all the topics which are covered.


So go ahead and be a VMware Ninja with all the knowledge!!!

Don't forget to share!! 


Sunday, November 15, 2015

vCenter / vRealize Operations Manager Dashboard Repository

This page is a repository of the all the vCenter Operations Manager and vRealize Operations Manager Dashboards. I will continue to add new dashboards to this page from myself and other community members. Feel free to use any of the dashboards in your environment and leave a comment below with your feedback:


****************************************************************************************************************************************
NSX LOAD-BALANCER MONITORING DASHBOARD
***************************************************************************************************************************************


Dashboard Name     :       NSX Load balancer Moniroting Dashboard
Author                      :       Luciano Gomes
Short Description     :       This dashboard helps with monitoring NSX Load Balancer Services.
Version Supported    :      vROps 6.x, NSX Management Pack 3.x
Product Version        :      Advanced / Enterprise Edition
Installation Guide     :      http://virtual-red-dot.info/sample-dashboards-to-monitor-nsx-load-balancers/


****************************************************************************************************************************************


****************************************************************************************************************************************
CLUSTER MANAGEMENT DASHBOARD
***************************************************************************************************************************************


Dashboard Name     :       Cluster Management Dashboard
Author                      :       Scott Norris
Short Description     :       This dashboard provides the various key components of a vSphere Cluster in a Single Pane of Glass.
Version Supported    :      vROps 6.x
Product Version        :      Advanced / Enterprise Edition
Installation Guide     :      http://www.virtualiseme.net.au/index.php/vrops-cluster-dashboard-step-by-step-how-too/


****************************************************************************************************************************************


****************************************************************************************************************************************
PERFORMANCE & CAPACITY DASHBOARD
***************************************************************************************************************************************


Dashboard Name    :       Performance & Capacity Dashboard
Author                        :       Sunny Dua
Short Description    :       A hybrid dashboard which would help you gauge the Capacity & Measure the performance of your virtual infrastructure from a single pane.
Version Supported    :       vROps 6.x
Product Version         :       Advanced / Enterprise Edition
Installation Guide      :       http://vxpresss.blogspot.sg/2015/11/creating-capacity-performance.html


****************************************************************************************************************************************


****************************************************************************************************************************************
EXCESSIVE VM IOPS DASHBOARD
***************************************************************************************************************************************


Dashboard Name    :       Excessive VM IOPS Dashboard
Author                        :       Iwan Rahabok
Short Description    :       With this dashboard, one can easily find a VM which is doing excessive amount of IOPS in your Virtual Infrastructure at any given point of time.
Version Supported    :       vROps 6.x
Product Version         :       Advanced / Enterprise Edition


****************************************************************************************************************************************


****************************************************************************************************************************************
HELP-DESK DASHBOARD
***************************************************************************************************************************************


Dashboard Name      :       Help Desk Dashboard
Author                        :       Sunny Dua
Short Description      :       This dashboard can be ideally used by your level 1 team to quickly understand the infrastructure areas which could be a performance bottleneck for a virtual machine.
Version Supported    :       vROps 6.x
Product Version         :       Advanced / Enterprise Edition
Installation Guide     :       http://vxpresss.blogspot.sg/2015/10/using-help-desk-dashboard-to-simplify.html


****************************************************************************************************************************************


****************************************************************************************************************************************
VIRTUAL SAN HARDWARE MONITORING DASHBOARD
***************************************************************************************************************************************


Dashboard Name      :       VSAN Monitoring Dashboard
Author                        :       Sunny Dua
Short Description      :       Monitor the key hardware components of VSAN by using this dashboard. This uses the VSAN management pack a.k.a. MPSD.
Version Supported    :       vROps 6.x, MPSD
Product Version         :       Advanced / Enterprise Edition
Installation Guide     :       http://vxpresss.blogspot.in/2015/09/monitoring-vsan-hardware-using-vrealize.html


****************************************************************************************************************************************


****************************************************************************************************************************************
DATASTORE UTILIZATION DASHBOARD
***************************************************************************************************************************************


Dashboard Name      :       Datastore Utilization Dashboard
Author                        :       Sunny Dua
Short Description      :       Monitor the space utilization of your datastores and the virtual machines using the space on those datastores.
Version Supported    :       vROps 6.x
Product Version         :       Advanced / Enterprise Edition
Installation Guide     :       http://vxpresss.blogspot.in/2015/07/monitor-datastores-using-datastore.html


****************************************************************************************************************************************


****************************************************************************************************************************************
CLUSTER CAPACITY DASHBOARD
***************************************************************************************************************************************


Dashboard Name      :       One Click Cluster Capacity Dashboard
Author                        :       Sunny Dua
Short Description      :       Quickly see the key capacity of each of your ESXi Clusters by a click of a button.
Version Supported    :       vROps 6.0.x
Product Version         :       Advanced / Enterprise Edition
Installation Guide     :       http://vxpresss.blogspot.in/2015/04/the-return-of-one-click-cluster.html

****************************************************************************************************************************************


****************************************************************************************************************************************
CRICKET WORLD CUP DASHBOARD
***************************************************************************************************************************************


Dashboard Name      :       Cricket World Cup Dashboard
Author                        :       Sunny Dua
Short Description   :   This dashboard is for having some fun with the dashboard feature of vCOps/vROps. You can build out a dashboard out of any webpage using this dashboard.
Version Supported    :       vCOps 5.x, vROps 6.x
Product Version         :       Advanced / Enterprise Edition
Installation Guide     :       http://vxpresss.blogspot.in/2015/02/catching-up-with-world-cup-cricket-2015.html
****************************************************************************************************************************************

****************************************************************************************************************************************
VIRTUAL DATA-CENTER CAPACITY DASHBOARD
***************************************************************************************************************************************


Dashboard Name      :       Virtual Datacenter Capacity Dashboard
Author                        :       Sunny Dua
Short Description   :   This dashboard helps you to look at capacity and performance metrics of your virtual datacenter. This provides you a holistic view of the environment.
Version Supported    :       vCOps 5.x
Product Version         :       Advanced / Enterprise Edition
Installation Guide     :       http://vxpresss.blogspot.in/2014/10/creating-one-click-datacenter-capacity.html


****************************************************************************************************************************************


****************************************************************************************************************************************
VIRTUAL DESKTOP INFRASTRUCTURE DASHBOARD
***************************************************************************************************************************************


Dashboard Name      :       VDI Dashboard
Author                        :       Sunny Dua
Short Description   :   This one-click high-level dashboard gathers the most important metrics in a typical VDI environment.  In the event of a production outage, this type of dashboard can be of monumental value.
Version Supported    :       vCOps 5.x, V4H Adapter
Product Version         :       Advanced / Enterprise Edition
Installation Guide     :       http://vxpresss.blogspot.in/2014/09/building-vdi-custom-dashboard-and.html
****************************************************************************************************************************************


****************************************************************************************************************************************
CLUSTER UTILIZATION DASHBOARD
***************************************************************************************************************************************


Dashboard Name      :       Cluster Utilization Dashboard
Author                        :       Sunny Dua
Short Description      :       Gives you a single page view of the Utilization of all your vSphere Clusters being monitored by vCenter Operations Manager
Version Supported    :       vCOps 5.x
Product Version         :       Advanced / Enterprise Edition
Installation Guide     :       http://vxpresss.blogspot.in/2014/04/part-1-creating-cluster-utilization.html
****************************************************************************************************************************************


****************************************************************************************************************************************
ONE CLICK CLUSTER CAPACITY DASHBOARD
***************************************************************************************************************************************


Dashboard Name      :       One Click Cluster Capacity Dashboard
Author                        :       Sunny Dua
Short Description      :       Quickly see the key capacity of each of your ESXi Clusters by a click of a button.
Version Supported    :       vCOps 5.x
Product Version         :       Advanced / Enterprise Edition
Installation Guide     :       http://vxpresss.blogspot.in/2014/03/part-1-creating-one-click-cluster.html
****************************************************************************************************************************************


****************************************************************************************************************************************
FAULT METRIC DASHBOARD
***************************************************************************************************************************************


Dashboard Name      :       Fault Metric Dashboard
Author                        :       Sunny Dua
Short Description      :       This dashboard can be used to track faults with Virtual Machines, ESXi Hosts & Datastores along with the Key Metrics associated with those objects.
Version Supported    :       vCOps 5.x
Product Version         :       Advanced / Enterprise Edition
Installation Guide     :       http://vxpresss.blogspot.sg/2013/10/creating-vcenter-operations-manager.html


****************************************************************************************************************************************


****************************************************************************************************************************************
DATASTORE USAGE DASHBOARD
***************************************************************************************************************************************


Dashboard Name      :       Datastore Usage%
Author                        :       Sunny Dua
Short Description      :       Provides a heatmap of all the datastores being monitored by vCenter Operations Manager. This will help you monitor the space remaining on the datastores in your virtual environment.
Version Supported    :       vCOps 5.x
Product Version         :       Advanced / Enterprise Edition
Installation Guide     :       http://vxpresss.blogspot.in/2013/05/part-1-using-vcops-super-metrics-custom.html

****************************************************************************************************************************************


The Chicken who went to Chilie!

Yeah..this one is not about vROps or VMware, it's not about VCDX or vExpert... It's about food which is my second love (after my family) :-) and I often love to cook for my loved ones. This time it is the story of the Chilie Chicken which I made last weekend for my wife. I posted the pictures on Facebook and my friends were keen on knowing the recipe for the dish. I have done recipes before on vXpress and I think this recipe would be a simple yet great addition to my blog entries.


Without further a-do let's look at what it takes to get the Chilie Chicken on your plate!


Ingredients :-

1- Boneless Chicken Cubes (12  pieces - Serves 2)

2- Red Onions - 3 Medium Sized

3- Green Capsicum - 1

4- Green Chilies - 4 to 5

5- 2 Egg Whites

6- Multi Purpose Flour - 3 Table Spoon

7- Oil for Frying - Olive or Vegetable

8 - Soy Sauce - 1.5 Table Spoon

9- Lemon - 1 Piece

10- Salt & Black Pepper Powder

11- Garlic Cloves - 4 Pieces

12- Chilie Vinegar - 1/2 table spoon


Recipe:-

1- Cut all the vegetables as shown in the picture below:


2- Beat the 2 Egg whites after adding a pinch of salt and pepper in it.


3- Coat the raw chicken cube with flour, dip it in the egg white mixture and then coat the multi-purpose flour on it and deep fry the same as shown below.


4- Once the chicken is fried & red in color, we are ready to bring together the dish. Take a deep pan, and pour 2 tablespoons of oil.

5- Once the oil is hot, add the chopped garlic.

6- Within 2 minutes the garlic would turn brown, it's time to add the onions.


7- Once the onions turn translucent, it's time to add Capsicum. Stir fry on high flame for 3 minutes.

8- Add the fried chicken cubes and continue to stir fry for 2 more minutes.

9- Add Salt / Black pepper to taste & chopped green chilies.

10- Add 1.5 table spoon of Soy Sauce and 1/2 tablespoon of vinegar.

11- Time to mix everything on a medium flame. Keep stirring and frying for another 5 minutes.

12- Turn off the flame and now add the juice of 1 Lemon and you are ready to serve.


Make sure to serve with some Red Wine or Chilled Beer.. It's HOT ;-)

Have Fun!!

Saturday, November 14, 2015

Creating a Capacity & Performance Management Dashboard in vRealize Operations 6.x

A few days back I tweeted about a hybrid dashboard which would help you gauge the Capacity & Measure the performance of your virtual infrastructure from a single pane. I call it the Capacity & Performance Management Dashboard which has been jointly built by Iwan Rahabok & myself. 


In my last post I wrote about the Help Desk Dashboard which was discussed during our VMworld session. This dashboard was also discussed in the VMworld session which me & Iwan presented and with this article, I will quickly run through the description of this dashboard, the use cases it solves and finally a quick and easy method to import this into your instances of vRealize Operations Manager. This dashboard does have 15 Super Metrics, 6 Views and 1 Customized XML file which helps you build the entire dashboard. While if you build this from scratch, creating this dashboard can take hours, but I promise you will spend under 10 minutes to operationalize this in your environment.

To begin with let's have a quick look at the dashboard. :-


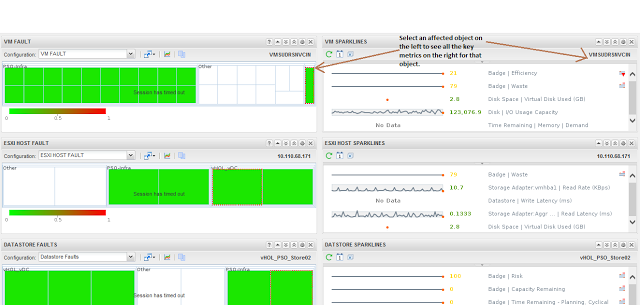
Here is a quick description of all the widgets of this dashboard:-

1- This lists all the clusters you are monitoring through vRealize Operations Manager 6.x

2- This widget display the key capacity metrics from a CPU, Memory & Storage perspective.

3- This widget provides the Peak & Average CPU Usage by an Virtual Machine in the selected cluster. This would basically give you an idea of how the virtual machines are using CPU in your environment. Is it Too Busy, Less Busy etc.

4- While the previous widget measure the usage, this widget looks at Peak & Average CPU Contention% which defines whether the demand of the CPU is being met without Contention at the CPU. Contention% is the key metric to measure CPU performance. 

5- This widget provides the Peak & Average Memory Usage by an Virtual Machine in the selected cluster. This would basically give you an idea of how the virtual machines are using RAM in your environment. Is it Too Busy, Less Busy etc.

6- Similar to CPU Contention, for Memory performance you need to measure the Memory Contention %. With this widget we measure the Peak & Average memory contention experienced by any virtual machine in the cluster. The contention will be seen as soon as you have memory over-commitment and more demand than supply which is not a great sign.

7- This widget shows the Peak & Average IOPS done by any virtual machine in the selected cluster. 

8- Alongside the IOPS you can see the Peak and Average Virtual Disk latency experienced by the virtual machines.

The above widgets showcase a number of metrics and most of them are Supermetrics which I will help you create in your environment!!


Here are the list of use cases where this dashboard can help you:-

1- Performance SLA Monitoring - If you have an agreed Performance SLA with the business measured in CPU & Memory Contention and Disk Latency then you can easily keep a track with this dashboard.

2- Performance Trending - Since this dashboard allows you to view the data from the past you can easily go back in time and look at how performance metrics trend in your environment.

3- Performance Driven Capacity Planning - This one is my favorite as you can now take capacity decisions based on your performance metrics. This basically means that if you need to ensure that as soon as you see performance metrics.

4- Capacity Overview - The capacity piece is quite obvious from the scorecard which talks about the consolidation ratios, summary of resources and the capacity remaining. With this in place you can easily see what kind of performance you are getting with over commitment of resources.


So if these reasons are compelling for you, let's go ahead and get you this dashboard. Go ahead and download the following files by clicking on the links below. Once you have these downloaded, we will begin creating the dashboard.


One you have these files, let's start with creating the dashboard. Follow the steps below:

IMPORT SUPERMETRICS & ENABLE THEM IN THE POLICY

1- Login to vROps with an account with Admin Privileges. Click on Content -> Super Metrics. Click on the Blue Wheel Icon and click on Import Super Metrics.


2 - Click the Browse button to go to SUPERMETRICS folder which you downloaded before and you need to select each super metric one by one and click on Open to Import all of them ONE by ONE.


3- One you import all of them, you will see a total of 15 Super Metrics in the list. Notice that these Super Metrics are already attached to the vCenter Adapter at the Cluster Compute Resource level.


4- Now let's enable these Super Metrics for collection in the Default Policy. Click on Administration -> Policies -> Policy Library -> Select the Default Policy - > Click on the Pencil shaped icon to Edit the policy.


5- Now click on the Collect Metrics and Properties option in the Edit Monitoring Policy Wizard and click on Collapse to see all the columns.


6- Click on Attribute type and uncheck everything except Supermetric to list all the of them.


7- In the Object Type select Cluster Compute Resource under the vCenter Adpater to list all the Super Metrics attached to a Cluster Object and you should see all the 15 super metrics which we imported earlier.


8- Finally, just select all the 15 metrics using CTRL + Mouse Left Click and click on Actions -> Enable to enable collection on all these super metrics.


Now that your Super Metrics are Ready, let's import the Views after 5 minutes or so.


IMPORTING VIEWS

 1- Click on Content -> Views -> Blue Wheel Icon -> Import


2- Browse to the file ALLVIEWS.xml which you downloaded before and click on open. Once the Views are imported you will see a successful message. Click on Done.


This would give you 6 new Views which the dashboard uses. Now let's create an XML for the Capacity Score card.


XML CREATION

1- Click on Content -> Manage Metric Config (You need vROps 6.0.2 or above), highlight the ResKndMetric Directory and click on the Green + Sign to add an XML.

2- Name the XML as CAPACITY-DATA.xml and click on OK.


3- Here is the XML you need to copy on the right pane. Please ensure that you use the right XML here. You have the following choices.

Choice 1 - If you have done a fresh install of vROps 6.1 then use this xml highlighted in BLUE Color:

<?xml version="1.0" encoding="UTF-8" standalone="yes"?>
<AdapterKinds>
<AdapterKind adapterKindKey="VMWARE">
<ResourceKind resourceKindKey="ClusterComputeResource"> 

<Metric attrkey="summary|total_number_hosts" label="ESXi Hosts" unit=" " yellow="63" orange="64" red="65" />
<Metric attrkey="summary|total_number_datastores" label="Datastores" unit=" " yellow="255" orange="256" red="257" />
<Metric attrkey="summary|total_number_vms" label="VMs and Templates" unit=" " yellow="5000" orange="6000" red="8000" />

<Metric attrkey="Super Metric|sm_a5a9c11a-f27c-446c-8bd5-48a11124b543" label="Total Datastore Capacity(TB)" unit="" yellow="16383" orange="16384" red="16385" />
<Metric attrkey="Super Metric|sm_6ad28eb5-ef7e-4a88-8fb7-8b4225944f48" label="Used Datastore Capacity(TB)" unit="" yellow="16383" orange="16384" red="16385" />
<Metric attrkey="Super Metric|sm_53c99a82-ecd7-4053-93cf-08b54be817c0" label="Remaining Datastore Capacity(%)" unit="" yellow="15" orange="10" red="5" />
 
<Metric attrkey="summary|avg_vm_density" label="Running VMs Per Host" unit=":1" yellow="50" orange="60" red="70" />
<Metric attrkey="cpu|demand|vConsumption.per.pConsumption" label="vCPU : pCPU" unit=":1" yellow="7.1" orange="8" red="9" />
<Metric attrkey="mem|consumed|vConsumption.per.pConsumption" label="vMEM : pMEM" unit="memory" yellow="1.26" orange="1.5" red="2" />

<Metric attrkey="summary|capacityRemainingUsingConsumers_average" label="Total VMs Remaining" unit="" yellow="10" orange="5" red="0" />
<Metric attrkey="cpu|capacityRemainingUsingConsumers_average" label="CPU - VM Remaining" unit="" yellow="10" orange="5" red="0" />
<Metric attrkey="mem|capacityRemainingUsingConsumers_average" label="MEMORY - VM Remaining" unit="" yellow="10" orange="5" red="0" />

</ResourceKind>
</AdapterKind>
</AdapterKinds>

Choice 2 - If you are running on any version of vROps 6.0.x or upgraded to 6.1 from any of these versions then use the xml highlighted in RED

<?xml version="1.0" encoding="UTF-8" standalone="yes"?>
<AdapterKinds>
<AdapterKind adapterKindKey="VMWARE">
<ResourceKind resourceKindKey="ClusterComputeResource"> 

<Metric attrkey="summary|total_number_hosts" label="ESXi Hosts" unit=" " yellow="63" orange="64" red="65" />
<Metric attrkey="summary|total_number_datastores" label="Datastores" unit=" " yellow="255" orange="256" red="257" />
<Metric attrkey="summary|total_number_vms" label="VMs and Templates" unit=" " yellow="5000" orange="6000" red="8000" />

<Metric attrkey="Super Metric|sm_a5a9c11a-f27c-446c-8bd5-48a11124b543" label="Total Datastore Capacity(TB)" unit="" yellow="16383" orange="16384" red="16385" />
<Metric attrkey="Super Metric|sm_6ad28eb5-ef7e-4a88-8fb7-8b4225944f48" label="Used Datastore Capacity(TB)" unit="" yellow="16383" orange="16384" red="16385" />
<Metric attrkey="Super Metric|sm_53c99a82-ecd7-4053-93cf-08b54be817c0" label="Remaining Datastore Capacity(%)" unit="" yellow="15" orange="10" red="5" />
 
<Metric attrkey="summary|avg_vm_density" label="Running VMs Per Host" unit=":1" yellow="50" orange="60" red="70" />
<Metric attrkey="cpu|demand|vConsumption.per.pConsumption" label="vCPU : pCPU" unit=":1" yellow="7.1" orange="8" red="9" />
<Metric attrkey="mem|demand|vConsumption.per.pConsumption" label="vMEM : pMEM" unit="memory" yellow="1.26" orange="1.5" red="2" />

<Metric attrkey="summary|capacityRemainingUsingConsumers_average" label="Total VMs Remaining" unit="" yellow="10" orange="5" red="0" />
<Metric attrkey="cpu|capacityRemainingUsingConsumers_average" label="CPU - VM Remaining" unit="" yellow="10" orange="5" red="0" />
<Metric attrkey="mem|capacityRemainingUsingConsumers_average" label="MEMORY - VM Remaining" unit="" yellow="10" orange="5" red="0" />

</ResourceKind>
</AdapterKind>

</AdapterKinds>

Once you have pasted the relevant xml click on Save.


IMPORT THE DASHBOARD


1- Click on Content -> Dashboards -> Blue Wheel Icon -> Import Dashboards


2- Browse to the downloaded file Cluster_cap_perf_db file and click on Open.


3- Once the Dashboard is imported successfully click on Done.


Phewww.. Guess what you have the dashboard now!! :-) Click on the Dashboard List option on the home page and you will see the Capacity Menu, click on that and you will see the Capacity & Performance Dashboard. Click on that to launch the dashboard. 

Click on any of your Clusters to see the capacity scores and the performance data. Please remember that these super metrics would start calculating now, hence you need to wait for a day or two to get some data around performance. Usually after a week or so, you will have some good data to solve those use cases which I mentioned above.

Alright, so this is done!! Do share you comments on how this dashboard helped you!!

Don't forget to share and spread the knowledge!!


Monday, November 2, 2015

Importing / Exporting Reports and Views in vRealize Operations Manager

This one would be quick note to tell you about the feature of Exporting and Importing Reports in vRealize Operations. In one of my previous articles, I wrote about creating a report out of a dashboard. Here is the link to that article

We all know that with Custom Reports, you can also pull in the Views to showcase a List, Chart etc with the kind of data you want in a vROps report. Hence, if you would need to create the View first and then create a report in which you would use that View. With vROps you do have the option of exporting a report and importing the same into any instance of vROps since all these reports are dynamic and are based on the Object Metrics.

The good news is that if you plan to import a pre-created report from on vROps instance to another, you would just need to import the Report and any custom views (one or more) would automatically get imported along with the report. You can then use these views in other reports as well in case you wish to.

Now this not only is a very handy feature, but this opens the platform for you to create and exchange reports with other members in the vCommunity pretty easily. This also gives me a task to share some of the reports which I have been creating for my clients through my blog.

Stay tuned for some Custom Reports which can please your business & management stakeholders with this powerful feature of vRealize Operations.


As always!!! Share & Spread the Knowledge.


Saturday, October 31, 2015

Using a Help Desk Dashboard to Simplify Operations With vRealize Operations Manager!

This post is a resultant of our VMworld 2015 content which we ( me and Iwan Rahabok) have been brewing since the mid of this year. Without taking any credit, I must say that all the content which we presented in various events such as architect bootcamps, VMworld and recently at the VMware APJ Tech Summit was the brainchild of my awesome buddy & colleague Iwan Rahabok.

Post these events, a lot of people have reached out to help them with development of dashboards which can help them effectively use vRealize Operations in there environments. With this post I would share a basic dashboard which can help you with day 2 day operations especially around performance troubleshooting in an organized manner.

We call it the help desk dashboard which can be ideally used by your level 1 team to quickly understand the infrastructure areas which could be a performance bottleneck for a virtual machine.

Let me quickly show you the dashboard and then I will help you build this in your vROps instance:


It's a simple yet effective dashboard and here are a few USE CASES where you can use the dashboard:-

Use Case 1 -  Quickly search for an affected VM & look at the Key Performance Indicators to get a direction for further troubleshooting (CPU, RAM, DISK, NETWORK etc.)

Use Case 2 - Quickly review the utilization of a VM for a past few days to months in case you have a request for resource addition such as CPU or Memory expansion.

Use Case 3 - This can also help the VM Right-Sizing Efforts as you can easily pull out the statistics around CPU or RAM utilization going back in Time and share the same with the app owners to get approvals on right-sizing.

Here are the key metrics which can be viewed with a click of a button in this dashboard:-
  • CPU Usage %
  • CPU Contention %
  • Memory Usage %
  • Memory Contention %
  • Network Workload %
  • Virtual Disk Latency (ms) aggregate for all disks in the VM

Well, if this interests you then let's see how we can get this dashboard. To begin with go ahead and download the following file by clicking on the link below. This is the original export of the dashboard which we will import later:-

Click here - HELPDESK-DASHBOARD EXPORT


Let's start building the dashboard now:-

1- Login to vRealize Operations with a user who has privileges to create a new dashboard.

2- Click on the Content tab and click on Manage Metric Config in the inventory window (you need vROps 6.0.1 or later versions for you to see this option. 

3- Under Manage Metric Config, click on ResKndMetric directory and click on the + Sign to create a new XML named - vmperf.xml

Paste the following xml code in blue color on the right pane and click on Save. A screenshot follows to guide you.

<?xml version="1.0" encoding="UTF-8" standalone="yes"?>
<AdapterKinds>
   <AdapterKind adapterKindKey="VMWARE">
      <ResourceKind resourceKindKey="VirtualMachine">
         <Metric attrkey="cpu|usage_average" label="" unit="%" yellow="85" orange="90" red="95" />
         <Metric attrkey="cpu|capacity_contentionPct" label="" unit="%" yellow="15" orange="20" red="30" />

         <Metric attrkey="mem|usage_average" label="" unit="%" yellow="85" orange="90" red="95" />
         <Metric attrkey="mem|host_contentionPct" label="" unit="%" yellow="15" orange="20" red="30" />

         <Metric attrkey="net|workload" label="" unit="%" yellow="85" orange="90" red="95" />
         <Metric attrkey="virtualDisk:Aggregate of all instances|totalLatency" label="" unit="ms" yellow="20" orange="30" red="40" />
         <Metric attrkey="virtualDisk:Aggregate of all instances|commandsAveraged_average" label="" unit="IOPS" yellow="10000" orange="30000" red="40000" />
         <Metric attrkey="diskspace|snapshot" label="" unit="" yellow="1" orange="2" red="3" />
      </ResourceKind>
   </AdapterKind>
   <AdapterKind adapterKindKey="bbb">
   </AdapterKind>
</AdapterKinds>


4- Now let's import the dashboard file which we downloaded before. Click on Content -> Dashboards - > Settings Button -> Import Dashboards. 


5- Select the HELPDESKDB.json file you downloaded earlier and click on OK to import the dashboard.


The above step would create the dashboard for you. Let us quickly share the dashboard as well.


6- Under the Dashboards Tab, Click on the settings button again and click on Share Dashboards.


7 - Now select the newly created HELPDESK Dashboard and drag & drop it on the groups with whom you want to share the same.


By now, you should have your dashboard ready to use. Please do let me know as to how you are using this dashboard in your environment in the comments sections..

Till then.. Do not forget to SHARE & SPREAD THE KNOWLEDGE!!