Showing posts with label custom dashboards. Show all posts

Friday, October 4, 2019

Copy and paste widgets from your favorite dashboards in vRealize Operations

While creating custom dashboards in vRealize Operations, there are times when you want to use the same widget type to be re-used within a dashboard multiple times. At the same time, you might want to re-use some of the widgets which you might like in the out of box dashboards and want to leverage the same to create your own dashboards.

In the past, you would do this by going through a lot of steps to literally recreate the entire widget and configure it to the tee. Depending upon the complexity of the customization, this could take from minutes to hours, especially if you are working on creating a dashboard with a number of widgets.

How cool it would be if you can just copy your favorite widgets from a pre-existing dashboard or configure once and replicate a widget multiple times within the same dashboard just by using simple copy and paste functions... 

Before vRealize Operations 7.5, this sounded like a BEAUTIFUL DREAM 😂

With vRealize Operations 7.5, we introduced a gem of functionality which in my humble opinion was lost in the huge list of amazing new features that came out with this release. The "What's New" section of release notes seems to be 4 pages long.

Within the release notes, you will notice a feature related to Dashboards and Widget Enhancements which talks about the functionality of copying and pasting widgets. Here is a screenshot from the release notes...


Feature Details:

As the release note mention, this capability allows you to pick up any dashboard, edit the dashboard and then select widgets within that dashboard by clicking through them, just like how you would select photos from a folder. You can select one or multiple widgets at the same time. Once selected, just use the CTRL+C on your keyboard or use the Actions menu to copy the widgets.

Once copied, you can open a new dashboard canvas in the same or a different browser session and then past the copied widget using CTRL+V or Actions -> Paste from the menu.

You would just need to redo interactions if any, else everything else will be pre-configured based on the base widget. This includes both widgets and views. Yes, you read it right.


Let's have a quick look at how this works:


Here is my favorite Capacity Utilization dashboard. I like some of the widgets in this dashboard which would take hours to configure manually. Let me just edit the dashboard and copy what I like into a new dashboard.

1- Launch the source dashboard you want to copy widgets.

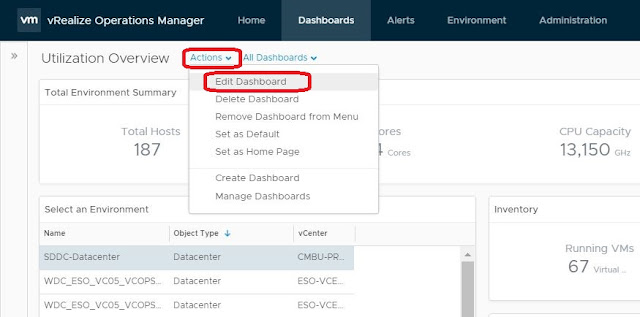
2- Click on Actions -> Edit Dashboard


3- Select the widgets you want to copy. Notice how they are highlighted with a blue outline as I select them.


4- Click on the actions button as indicated below to select Copy Widgets(s) or use the keyboard shortcut for copy.


5- Now you can cancel out of this dashboard as the copy is done.

6- Click on the Actions Menu under dashboards and click on Create Dashboard.

7- Once the new dashboard canvas opens, click on Actions -> Past Widget(s)


Just like that.. It's done in seconds. Saving you a number of hours and getting you to your goal of getting that perfect dashboard you always wanted 😃😃😃

From this point onwards, you can make the delta changes you need in your target dashboard and setup any interactions if applicable and you are good to go..

To find some cool dashboards you might want to copy from, explore the vRealize Operations community created dashboard repository on VMware Code.

Hope this article helps you. Please share your comments in the comments section below or follow me on twitter to be updated on similar content - @sunny_dua.


Sunday, February 26, 2017

vROps is EASY!!!

While that sounds like a whacky title.. You will only believe when you see the video I am about to share... Full credit of this video goes to Matt Bradford who blogs at http://www.vmspot.com/ . He has clearly knocked it out of the park to show you how easy it is to make vRealize Operations Dashboards and how broad is the spectrum of the product as compared to "SO CALLED COMPETITION". Not saying that competition is bad, but in operations it is all about choice.

Choice to see what you want to see.. Choice to Slice and Dice data, Choice to present data so that it makes sense to the super nerd and the layman.. That is the power of vROps and it custom dash-boarding capabilities.

So if you are the one who thinks vROps is difficult, it is showing too many things, I don't know what to look at and all that JAZZ!!

Go see this...


If someone said operations is simple!! They are fooling you.. It is more complex than any other process or technology out there.. You know WHY? Because it involves human.. While we know a lot about Human Behavior, no science has cracked the code yet... So when you are dealing with People, Process and Perceptions you need something which can help you put your thought process on a canvas.. Guess what?? vROps can do that!! 

So go figure....

Thanks Matt for making this video.. you made my day!!


Sunday, November 15, 2015

vCenter / vRealize Operations Manager Dashboard Repository

This page is a repository of the all the vCenter Operations Manager and vRealize Operations Manager Dashboards. I will continue to add new dashboards to this page from myself and other community members. Feel free to use any of the dashboards in your environment and leave a comment below with your feedback:


****************************************************************************************************************************************
NSX LOAD-BALANCER MONITORING DASHBOARD
***************************************************************************************************************************************


Dashboard Name     :       NSX Load balancer Moniroting Dashboard
Author                      :       Luciano Gomes
Short Description     :       This dashboard helps with monitoring NSX Load Balancer Services.
Version Supported    :      vROps 6.x, NSX Management Pack 3.x
Product Version        :      Advanced / Enterprise Edition
Installation Guide     :      http://virtual-red-dot.info/sample-dashboards-to-monitor-nsx-load-balancers/


****************************************************************************************************************************************


****************************************************************************************************************************************
CLUSTER MANAGEMENT DASHBOARD
***************************************************************************************************************************************


Dashboard Name     :       Cluster Management Dashboard
Author                      :       Scott Norris
Short Description     :       This dashboard provides the various key components of a vSphere Cluster in a Single Pane of Glass.
Version Supported    :      vROps 6.x
Product Version        :      Advanced / Enterprise Edition
Installation Guide     :      http://www.virtualiseme.net.au/index.php/vrops-cluster-dashboard-step-by-step-how-too/


****************************************************************************************************************************************


****************************************************************************************************************************************
PERFORMANCE & CAPACITY DASHBOARD
***************************************************************************************************************************************


Dashboard Name    :       Performance & Capacity Dashboard
Author                        :       Sunny Dua
Short Description    :       A hybrid dashboard which would help you gauge the Capacity & Measure the performance of your virtual infrastructure from a single pane.
Version Supported    :       vROps 6.x
Product Version         :       Advanced / Enterprise Edition
Installation Guide      :       http://vxpresss.blogspot.sg/2015/11/creating-capacity-performance.html


****************************************************************************************************************************************


****************************************************************************************************************************************
EXCESSIVE VM IOPS DASHBOARD
***************************************************************************************************************************************


Dashboard Name    :       Excessive VM IOPS Dashboard
Author                        :       Iwan Rahabok
Short Description    :       With this dashboard, one can easily find a VM which is doing excessive amount of IOPS in your Virtual Infrastructure at any given point of time.
Version Supported    :       vROps 6.x
Product Version         :       Advanced / Enterprise Edition


****************************************************************************************************************************************


****************************************************************************************************************************************
HELP-DESK DASHBOARD
***************************************************************************************************************************************


Dashboard Name      :       Help Desk Dashboard
Author                        :       Sunny Dua
Short Description      :       This dashboard can be ideally used by your level 1 team to quickly understand the infrastructure areas which could be a performance bottleneck for a virtual machine.
Version Supported    :       vROps 6.x
Product Version         :       Advanced / Enterprise Edition
Installation Guide     :       http://vxpresss.blogspot.sg/2015/10/using-help-desk-dashboard-to-simplify.html


****************************************************************************************************************************************


****************************************************************************************************************************************
VIRTUAL SAN HARDWARE MONITORING DASHBOARD
***************************************************************************************************************************************


Dashboard Name      :       VSAN Monitoring Dashboard
Author                        :       Sunny Dua
Short Description      :       Monitor the key hardware components of VSAN by using this dashboard. This uses the VSAN management pack a.k.a. MPSD.
Version Supported    :       vROps 6.x, MPSD
Product Version         :       Advanced / Enterprise Edition
Installation Guide     :       http://vxpresss.blogspot.in/2015/09/monitoring-vsan-hardware-using-vrealize.html


****************************************************************************************************************************************


****************************************************************************************************************************************
DATASTORE UTILIZATION DASHBOARD
***************************************************************************************************************************************


Dashboard Name      :       Datastore Utilization Dashboard
Author                        :       Sunny Dua
Short Description      :       Monitor the space utilization of your datastores and the virtual machines using the space on those datastores.
Version Supported    :       vROps 6.x
Product Version         :       Advanced / Enterprise Edition
Installation Guide     :       http://vxpresss.blogspot.in/2015/07/monitor-datastores-using-datastore.html


****************************************************************************************************************************************


****************************************************************************************************************************************
CLUSTER CAPACITY DASHBOARD
***************************************************************************************************************************************


Dashboard Name      :       One Click Cluster Capacity Dashboard
Author                        :       Sunny Dua
Short Description      :       Quickly see the key capacity of each of your ESXi Clusters by a click of a button.
Version Supported    :       vROps 6.0.x
Product Version         :       Advanced / Enterprise Edition
Installation Guide     :       http://vxpresss.blogspot.in/2015/04/the-return-of-one-click-cluster.html

****************************************************************************************************************************************


****************************************************************************************************************************************
CRICKET WORLD CUP DASHBOARD
***************************************************************************************************************************************


Dashboard Name      :       Cricket World Cup Dashboard
Author                        :       Sunny Dua
Short Description   :   This dashboard is for having some fun with the dashboard feature of vCOps/vROps. You can build out a dashboard out of any webpage using this dashboard.
Version Supported    :       vCOps 5.x, vROps 6.x
Product Version         :       Advanced / Enterprise Edition
Installation Guide     :       http://vxpresss.blogspot.in/2015/02/catching-up-with-world-cup-cricket-2015.html
****************************************************************************************************************************************

****************************************************************************************************************************************
VIRTUAL DATA-CENTER CAPACITY DASHBOARD
***************************************************************************************************************************************


Dashboard Name      :       Virtual Datacenter Capacity Dashboard
Author                        :       Sunny Dua
Short Description   :   This dashboard helps you to look at capacity and performance metrics of your virtual datacenter. This provides you a holistic view of the environment.
Version Supported    :       vCOps 5.x
Product Version         :       Advanced / Enterprise Edition
Installation Guide     :       http://vxpresss.blogspot.in/2014/10/creating-one-click-datacenter-capacity.html


****************************************************************************************************************************************


****************************************************************************************************************************************
VIRTUAL DESKTOP INFRASTRUCTURE DASHBOARD
***************************************************************************************************************************************


Dashboard Name      :       VDI Dashboard
Author                        :       Sunny Dua
Short Description   :   This one-click high-level dashboard gathers the most important metrics in a typical VDI environment.  In the event of a production outage, this type of dashboard can be of monumental value.
Version Supported    :       vCOps 5.x, V4H Adapter
Product Version         :       Advanced / Enterprise Edition
Installation Guide     :       http://vxpresss.blogspot.in/2014/09/building-vdi-custom-dashboard-and.html
****************************************************************************************************************************************


****************************************************************************************************************************************
CLUSTER UTILIZATION DASHBOARD
***************************************************************************************************************************************


Dashboard Name      :       Cluster Utilization Dashboard
Author                        :       Sunny Dua
Short Description      :       Gives you a single page view of the Utilization of all your vSphere Clusters being monitored by vCenter Operations Manager
Version Supported    :       vCOps 5.x
Product Version         :       Advanced / Enterprise Edition
Installation Guide     :       http://vxpresss.blogspot.in/2014/04/part-1-creating-cluster-utilization.html
****************************************************************************************************************************************


****************************************************************************************************************************************
ONE CLICK CLUSTER CAPACITY DASHBOARD
***************************************************************************************************************************************


Dashboard Name      :       One Click Cluster Capacity Dashboard
Author                        :       Sunny Dua
Short Description      :       Quickly see the key capacity of each of your ESXi Clusters by a click of a button.
Version Supported    :       vCOps 5.x
Product Version         :       Advanced / Enterprise Edition
Installation Guide     :       http://vxpresss.blogspot.in/2014/03/part-1-creating-one-click-cluster.html
****************************************************************************************************************************************


****************************************************************************************************************************************
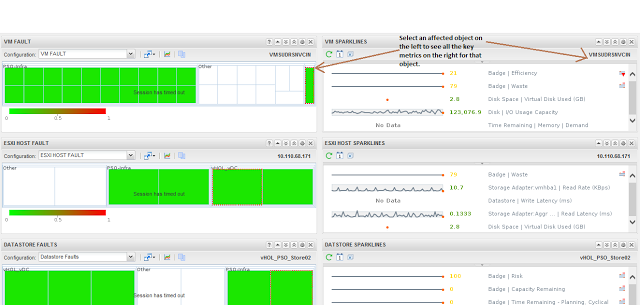
FAULT METRIC DASHBOARD
***************************************************************************************************************************************


Dashboard Name      :       Fault Metric Dashboard
Author                        :       Sunny Dua
Short Description      :       This dashboard can be used to track faults with Virtual Machines, ESXi Hosts & Datastores along with the Key Metrics associated with those objects.
Version Supported    :       vCOps 5.x
Product Version         :       Advanced / Enterprise Edition
Installation Guide     :       http://vxpresss.blogspot.sg/2013/10/creating-vcenter-operations-manager.html


****************************************************************************************************************************************


****************************************************************************************************************************************
DATASTORE USAGE DASHBOARD
***************************************************************************************************************************************


Dashboard Name      :       Datastore Usage%
Author                        :       Sunny Dua
Short Description      :       Provides a heatmap of all the datastores being monitored by vCenter Operations Manager. This will help you monitor the space remaining on the datastores in your virtual environment.
Version Supported    :       vCOps 5.x
Product Version         :       Advanced / Enterprise Edition
Installation Guide     :       http://vxpresss.blogspot.in/2013/05/part-1-using-vcops-super-metrics-custom.html

****************************************************************************************************************************************


Saturday, November 14, 2015

Creating a Capacity & Performance Management Dashboard in vRealize Operations 6.x

A few days back I tweeted about a hybrid dashboard which would help you gauge the Capacity & Measure the performance of your virtual infrastructure from a single pane. I call it the Capacity & Performance Management Dashboard which has been jointly built by Iwan Rahabok & myself. 


In my last post I wrote about the Help Desk Dashboard which was discussed during our VMworld session. This dashboard was also discussed in the VMworld session which me & Iwan presented and with this article, I will quickly run through the description of this dashboard, the use cases it solves and finally a quick and easy method to import this into your instances of vRealize Operations Manager. This dashboard does have 15 Super Metrics, 6 Views and 1 Customized XML file which helps you build the entire dashboard. While if you build this from scratch, creating this dashboard can take hours, but I promise you will spend under 10 minutes to operationalize this in your environment.

To begin with let's have a quick look at the dashboard. :-


Here is a quick description of all the widgets of this dashboard:-

1- This lists all the clusters you are monitoring through vRealize Operations Manager 6.x

2- This widget display the key capacity metrics from a CPU, Memory & Storage perspective.

3- This widget provides the Peak & Average CPU Usage by an Virtual Machine in the selected cluster. This would basically give you an idea of how the virtual machines are using CPU in your environment. Is it Too Busy, Less Busy etc.

4- While the previous widget measure the usage, this widget looks at Peak & Average CPU Contention% which defines whether the demand of the CPU is being met without Contention at the CPU. Contention% is the key metric to measure CPU performance. 

5- This widget provides the Peak & Average Memory Usage by an Virtual Machine in the selected cluster. This would basically give you an idea of how the virtual machines are using RAM in your environment. Is it Too Busy, Less Busy etc.

6- Similar to CPU Contention, for Memory performance you need to measure the Memory Contention %. With this widget we measure the Peak & Average memory contention experienced by any virtual machine in the cluster. The contention will be seen as soon as you have memory over-commitment and more demand than supply which is not a great sign.

7- This widget shows the Peak & Average IOPS done by any virtual machine in the selected cluster. 

8- Alongside the IOPS you can see the Peak and Average Virtual Disk latency experienced by the virtual machines.

The above widgets showcase a number of metrics and most of them are Supermetrics which I will help you create in your environment!!


Here are the list of use cases where this dashboard can help you:-

1- Performance SLA Monitoring - If you have an agreed Performance SLA with the business measured in CPU & Memory Contention and Disk Latency then you can easily keep a track with this dashboard.

2- Performance Trending - Since this dashboard allows you to view the data from the past you can easily go back in time and look at how performance metrics trend in your environment.

3- Performance Driven Capacity Planning - This one is my favorite as you can now take capacity decisions based on your performance metrics. This basically means that if you need to ensure that as soon as you see performance metrics.

4- Capacity Overview - The capacity piece is quite obvious from the scorecard which talks about the consolidation ratios, summary of resources and the capacity remaining. With this in place you can easily see what kind of performance you are getting with over commitment of resources.


So if these reasons are compelling for you, let's go ahead and get you this dashboard. Go ahead and download the following files by clicking on the links below. Once you have these downloaded, we will begin creating the dashboard.


One you have these files, let's start with creating the dashboard. Follow the steps below:

IMPORT SUPERMETRICS & ENABLE THEM IN THE POLICY

1- Login to vROps with an account with Admin Privileges. Click on Content -> Super Metrics. Click on the Blue Wheel Icon and click on Import Super Metrics.


2 - Click the Browse button to go to SUPERMETRICS folder which you downloaded before and you need to select each super metric one by one and click on Open to Import all of them ONE by ONE.


3- One you import all of them, you will see a total of 15 Super Metrics in the list. Notice that these Super Metrics are already attached to the vCenter Adapter at the Cluster Compute Resource level.


4- Now let's enable these Super Metrics for collection in the Default Policy. Click on Administration -> Policies -> Policy Library -> Select the Default Policy - > Click on the Pencil shaped icon to Edit the policy.


5- Now click on the Collect Metrics and Properties option in the Edit Monitoring Policy Wizard and click on Collapse to see all the columns.


6- Click on Attribute type and uncheck everything except Supermetric to list all the of them.


7- In the Object Type select Cluster Compute Resource under the vCenter Adpater to list all the Super Metrics attached to a Cluster Object and you should see all the 15 super metrics which we imported earlier.


8- Finally, just select all the 15 metrics using CTRL + Mouse Left Click and click on Actions -> Enable to enable collection on all these super metrics.


Now that your Super Metrics are Ready, let's import the Views after 5 minutes or so.


IMPORTING VIEWS

 1- Click on Content -> Views -> Blue Wheel Icon -> Import


2- Browse to the file ALLVIEWS.xml which you downloaded before and click on open. Once the Views are imported you will see a successful message. Click on Done.


This would give you 6 new Views which the dashboard uses. Now let's create an XML for the Capacity Score card.


XML CREATION

1- Click on Content -> Manage Metric Config (You need vROps 6.0.2 or above), highlight the ResKndMetric Directory and click on the Green + Sign to add an XML.

2- Name the XML as CAPACITY-DATA.xml and click on OK.


3- Here is the XML you need to copy on the right pane. Please ensure that you use the right XML here. You have the following choices.

Choice 1 - If you have done a fresh install of vROps 6.1 then use this xml highlighted in BLUE Color:

<?xml version="1.0" encoding="UTF-8" standalone="yes"?>
<AdapterKinds>
<AdapterKind adapterKindKey="VMWARE">
<ResourceKind resourceKindKey="ClusterComputeResource"> 

<Metric attrkey="summary|total_number_hosts" label="ESXi Hosts" unit=" " yellow="63" orange="64" red="65" />
<Metric attrkey="summary|total_number_datastores" label="Datastores" unit=" " yellow="255" orange="256" red="257" />
<Metric attrkey="summary|total_number_vms" label="VMs and Templates" unit=" " yellow="5000" orange="6000" red="8000" />

<Metric attrkey="Super Metric|sm_a5a9c11a-f27c-446c-8bd5-48a11124b543" label="Total Datastore Capacity(TB)" unit="" yellow="16383" orange="16384" red="16385" />
<Metric attrkey="Super Metric|sm_6ad28eb5-ef7e-4a88-8fb7-8b4225944f48" label="Used Datastore Capacity(TB)" unit="" yellow="16383" orange="16384" red="16385" />
<Metric attrkey="Super Metric|sm_53c99a82-ecd7-4053-93cf-08b54be817c0" label="Remaining Datastore Capacity(%)" unit="" yellow="15" orange="10" red="5" />
 
<Metric attrkey="summary|avg_vm_density" label="Running VMs Per Host" unit=":1" yellow="50" orange="60" red="70" />
<Metric attrkey="cpu|demand|vConsumption.per.pConsumption" label="vCPU : pCPU" unit=":1" yellow="7.1" orange="8" red="9" />
<Metric attrkey="mem|consumed|vConsumption.per.pConsumption" label="vMEM : pMEM" unit="memory" yellow="1.26" orange="1.5" red="2" />

<Metric attrkey="summary|capacityRemainingUsingConsumers_average" label="Total VMs Remaining" unit="" yellow="10" orange="5" red="0" />
<Metric attrkey="cpu|capacityRemainingUsingConsumers_average" label="CPU - VM Remaining" unit="" yellow="10" orange="5" red="0" />
<Metric attrkey="mem|capacityRemainingUsingConsumers_average" label="MEMORY - VM Remaining" unit="" yellow="10" orange="5" red="0" />

</ResourceKind>
</AdapterKind>
</AdapterKinds>

Choice 2 - If you are running on any version of vROps 6.0.x or upgraded to 6.1 from any of these versions then use the xml highlighted in RED

<?xml version="1.0" encoding="UTF-8" standalone="yes"?>
<AdapterKinds>
<AdapterKind adapterKindKey="VMWARE">
<ResourceKind resourceKindKey="ClusterComputeResource"> 

<Metric attrkey="summary|total_number_hosts" label="ESXi Hosts" unit=" " yellow="63" orange="64" red="65" />
<Metric attrkey="summary|total_number_datastores" label="Datastores" unit=" " yellow="255" orange="256" red="257" />
<Metric attrkey="summary|total_number_vms" label="VMs and Templates" unit=" " yellow="5000" orange="6000" red="8000" />

<Metric attrkey="Super Metric|sm_a5a9c11a-f27c-446c-8bd5-48a11124b543" label="Total Datastore Capacity(TB)" unit="" yellow="16383" orange="16384" red="16385" />
<Metric attrkey="Super Metric|sm_6ad28eb5-ef7e-4a88-8fb7-8b4225944f48" label="Used Datastore Capacity(TB)" unit="" yellow="16383" orange="16384" red="16385" />
<Metric attrkey="Super Metric|sm_53c99a82-ecd7-4053-93cf-08b54be817c0" label="Remaining Datastore Capacity(%)" unit="" yellow="15" orange="10" red="5" />
 
<Metric attrkey="summary|avg_vm_density" label="Running VMs Per Host" unit=":1" yellow="50" orange="60" red="70" />
<Metric attrkey="cpu|demand|vConsumption.per.pConsumption" label="vCPU : pCPU" unit=":1" yellow="7.1" orange="8" red="9" />
<Metric attrkey="mem|demand|vConsumption.per.pConsumption" label="vMEM : pMEM" unit="memory" yellow="1.26" orange="1.5" red="2" />

<Metric attrkey="summary|capacityRemainingUsingConsumers_average" label="Total VMs Remaining" unit="" yellow="10" orange="5" red="0" />
<Metric attrkey="cpu|capacityRemainingUsingConsumers_average" label="CPU - VM Remaining" unit="" yellow="10" orange="5" red="0" />
<Metric attrkey="mem|capacityRemainingUsingConsumers_average" label="MEMORY - VM Remaining" unit="" yellow="10" orange="5" red="0" />

</ResourceKind>
</AdapterKind>

</AdapterKinds>

Once you have pasted the relevant xml click on Save.


IMPORT THE DASHBOARD


1- Click on Content -> Dashboards -> Blue Wheel Icon -> Import Dashboards


2- Browse to the downloaded file Cluster_cap_perf_db file and click on Open.


3- Once the Dashboard is imported successfully click on Done.


Phewww.. Guess what you have the dashboard now!! :-) Click on the Dashboard List option on the home page and you will see the Capacity Menu, click on that and you will see the Capacity & Performance Dashboard. Click on that to launch the dashboard. 

Click on any of your Clusters to see the capacity scores and the performance data. Please remember that these super metrics would start calculating now, hence you need to wait for a day or two to get some data around performance. Usually after a week or so, you will have some good data to solve those use cases which I mentioned above.

Alright, so this is done!! Do share you comments on how this dashboard helped you!!

Don't forget to share and spread the knowledge!!