Tuesday, April 14, 2020

vRealize Operations Cloud - The one stop shop for multi-cloud operations is LIVE


About vRealize Operations Cloud:


Along with vRealize Operations 8.1, VMware just made the vRealize Operations Cloud service go live. VMware vRealize Operations Cloud is a cloud-delivered service that allows a customer’s infrastructure and operations teams to manage the enterprise’s VMware Cloud environment, whether in the customer’s own on-premises software-defined data center (“SDDC”) or in the customer’s hosted environment, such as VMware Cloud on AWS.

·       vRealize Operations Cloud has the same feature capabilities as the On-premises vRealize Operations Manager 8.1, with the operational agility and benefits of SaaS

·       The service is offered on the Cloud Service Platform thereby providing a consistent experience to customers who are consuming other VMware Cloud Services and leveraging common services for Identity Management, Billing, and Support.

·       vROps Cloud provides integrations with other vRealize SaaS Offerings namely vRealize Log Insight Cloud, vRealize Network Insight Cloud, and vRealize Automation Cloud

·       Exclusive in vROps Cloud: View logs in context of the selected object in vRealize Operations Cloud; Launch into the full capabilities of vRealize Log Insight Cloud at the click of a button


Purchasing vROps Cloud:


Refer to vROps Cloud Pricing for the latest information on pricing.


vROps Cloud Documentation & Resources:


vRealize Operations 8.1 is out. Here is everything you need to know.

VMware just announced the General Availability of vRealize Operations 8.1. I wanted to quickly share the high-level capabilities that are coming with this release. These are based on key themes of VMware's Cloud Operations vision. 

vRealize Operations Manager 8.1 delivers new and enhanced capabilities for self-driving operations to help customers optimize, plan, and scale VMware Cloud, which includes on-premises private cloud or VMware SDDC in multiple public clouds such as VMware Cloud on AWS, while at the same time unifying multi-cloud monitoring. Powered by artificial intelligence (AI), this release takes us one step closer to the Cloud Operations Vision of providing a unified operations platform, deliver continuous performance optimization, efficient capacity, and cost management, proactive planning, app-aware intelligent remediation, and integrated compliance. 

The key release themes include:

Integrated and Intelligent

  • Support for vSphere 7 with Kubernetes helps operationalize vSphere with Kubernetes by enabling you to monitor the health, performance, and the capacity of constructs such as Namespaces, Tanzu Kubernetes cluster, and vSphere Pods.
  • Self-driving Operations for VMware Cloud on AWS provides native support for VMware Cloud on AWS. It simplifies Cloud Account for VMware Cloud on AWS, leveraging VMware Cloud Service Portal Token and will be able to auto-Discover new SDDCs and incorporate for monitoring in a few simple steps.
  • Intelligent Alert importance ranking to help prioritize triggered alerts based on access and occurrence frequency analysis. 
  • Enhanced and updated management packs to support the new release. There are multiple enhancements to various management packs with this release. Refer to the VMware Product Interoperability Matrix for all VMware Management Packs supported with vRealize Operations Manager 8.1. The 3rd party authored Management Packs that are supported with 8.1 are listed in the VMware Compatibility Guide.
  • Native support for regulatory compliance packs 
  • Integrations. Integrations. Integrations

Easy Management
  • Simplified alert management with the ability to create and modify alert definitions and manage changes across alerts, symptoms, recommendations, policies, and notifications using a simplified workflow. This includes enhanced notification filters as well.
  • Simplified and intuitive summary pages for key objects to simplify monitoring and troubleshooting with quick access to key information.
  • Enhanced Dashboard Management capabilities such as search, arrange, maximize widgets, etc. to simplify the user experience.
  • Consistent navigation via improved menus across the workflows to enhance ease of use.


 Application-Aware and Multi-Cloud
  • Application Operations enhancements with the ability to do credential-less discovery of services leveraging VMware Tools.
  • Telegraf Agent lifecycle management with public API support for application monitoring at large scale.
  • Native Support for Azure via Cloud account and monitoring Azure services.
  • Enhanced Public cloud monitoring support with an introduction to Google Cloud Platform (GCP) integration in addition to existing support of AWS and Azure.
  • Enhanced cloud costing with Cloud Health perspectives.
  • Out of box dashboards, Reports and Alerts to manage VMware Cloud on AWS, Public Clouds, and vSphere with Kubernetes


For a detailed list of enhancements refer to the release notes.

·       Download Link: vRealize Operations 8.1 Download Landing Page

·       Release Notes:  Release Notes

Monday, October 28, 2019

vRealize Operations dashboards to monitor VMware Cloud on AWS

I have seen a number of asks for dashboards that can help with monitoring specific use cases related to VMware Cloud on AWS. With this post, I will share four such dashboards that I have been working on pertaining to VMC monitoring use cases. Special thanks to William Lam for guiding me with the best practices related to VMC monitoring. All those best practices were considered while creating these dashboards.

Along with the description and usage if these dashboards, this post will also provide the pre-requisites and few simple steps to import these dashboards in your environment.


About the dashboards

Once imported you will see the following four dashboards under a new dashboard group named "VMC Dashboards".


VMC Capacity Dashboard

​Purpose

This dashboard provides a capacity overview of each of your VMC SDDC. You can easily drill down into the capacity of all the underlying components such as Clusters, Hosts, VMs, Datastores, and Diskgroups.

How to use this dashboard?
  • The first 3 rows show you a card per VMC SDDC with 3 different dimensions. This includes Capacity Remaining, Time Remaining and VM Remaining.
  • Upon selecting an SDDC, you can see the clusters, hosts, VMs (both management and workload), datastores and disk groups. 
  • The key KPIs are color-coded to help identify capacity bottlenecks.


VMC Inventory Dashboard

Purpose
This dashboard provides a quick overview of inventory of all your VMC SDDCs. The inventory includes:
  • vSphere Clusters
  • Datastores
  • Hosts
  • Virtual Machines
How to use this dashboard?
  • The first row shows you a card per VMC SDDC with number of virtual machines running in each SDDC. This also shows you a trend of virtual machine growth over the past 30 days.
  • Once you are close to the number of VMs supported per SDDC, the card will indicate that by changing colors.
  • Upon selecting a card, you can see the list of all the vSphere Clusters, Datastores, vSphere Hosts and VMs in that SDDC with key configuration details.
  • You can choose to export the desired list in a CSV format using the toolbars on the list.
  • You can also filter the list of vSphere Hosts and VMs by selecting a vSphere Cluster or list of VMs by selecting a vSphere Host.


VMC Management VM Dashboard

​Purpose


This dashboard helps you monitor the utilization and performance of the key management VMs running in your SDDC. The goal of this dashboard is to ensure that the management components such as vCenter and NSX are not facing any resource bottleneck from a CPU, Memory, Network and Storage perspective.

How to use this dashboard?

  • The first list provides all the management components in each SDDC with key CPU utilization and performance KPIs. Upon selecting a management VM, you can see the usage and performance trends of all the CPU cores.
  • The second list provides all the management components in each SDDC with key Memory utilization and performance KPIs. Upon selecting a management VM, you can see the memory usage and performance trends.
  • The third list provides all the management components in each SDDC with key Network utilization and performance KPIs. Upon selecting a management VM, you can see the network usage and performance trends.
  • The fourth list provides all the management components in each SDDC with key Storage utilization and performance KPIs. Upon selecting a management VM, you can see the storage usage and performance trends.


VMC Utilization and Performance Dashboard
​​
Purpose

This dashboard provides a utilization and performance overview of each SDDC based on heavy hitter VMs and impacted VMs over the last 30 days of utilization and performance KPIs


How to use this dashboard?

  • The first list shows the list of all the SDDC with aggregate CPU, Memory ad Storage utilization over the last 30 days with Maximum and 95th Percentile values.
  • Upon selecting an SDDC, you can see the list of top virtual machines which are consuming Compute, Network & Storage resources in each SDDC.
  • The dashboard has 2 sections thereafter. One shows the Compute (CPU & Memory) utilization and performance analysis and the second shows the Network and Storage utilization and performance analysis.
  • Each section is based on the last 30 days of data with 95th percentile transformation which is configurable as needed to Max, Average, Current, Standard Deviation or other mathematical transformations.
  • This data helps you find the victims and villains in your environment which are negatively impacting capacity or performance from a CPU, Memory, Storage or Network perspective.


Pre-requisites

The following pre-requisites should be taken care of before importing these dashboards.
  • These dashboards need either vRealize Operations version 7.5 or 8.0.
  • These dashboards are tested with VMC SDDC version 1.7 and above.
  • Both vCenter and vSAN adapter instances should be configured.
  • Need vRealize Operations Advanced edition or above.
  • Need appropriate vRealize Operations permissions to import and share.

Steps to import

1- Ensure that your VMC vCenters instances are configured with Cloud Type as "VMware Cloud on AWS". More details here.

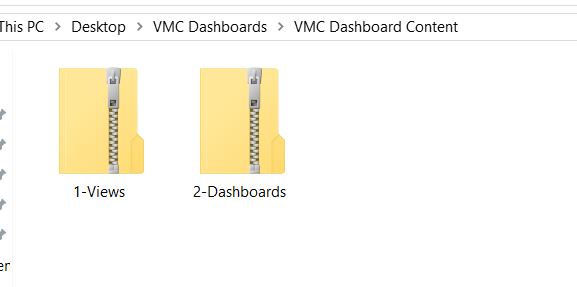
2- Download this VMC Dashboard Content.zip file and extract it to your desktop.


3- Import 1-Views.zip file to your vROps instance. Click on Dashboards - Views - Actions - Import Views

4- Import 2-Dashboards.zip file to your vROps instance.  Click on Dashboards - Actions - Manage Dashboards - Action - Import Dashboards.

You should have your dashboards by now. Please note that these dashboards might take a few seconds to load for the first time. 

Hope this article helps you. Please share your comments in the comments section below or follow me on twitter to be updated on similar content - @sunny_dua.


Friday, October 18, 2019

Everything you need to know about the vRealize Operations 8.0 release

The wait is over. vRealize Operations 8.0 is NOW Available. Here are my prescribed next steps:


4- Ensure to run the Upgrade Assessment Tool, available on the download page:


      5- Check the compatibility with management packs you might have in your environment - https://www.vmware.com/resources/compatibility/search.php?deviceCategory=vrops
    
      6- Check product compatibility matrix (just in case) - https://www.vmware.com/resources/compatibility/sim/interop_matrix.php

      7- Good news – Most of the VMware solution packs that go with vROps are already released and here are the links:


Solution Name
Release Notes & Download Link
vRealize Operations Management Pack for CloudHealth by VMware
vRealize Operations Management Pack for Storage Devices
vRealize Operations Management Pack for VMware Cloud on AWS
vRealize Operations Management Pack for NSX-T
vRealize Operations Management Pack for vCloud Director
vRealize Operations Management Pack for Skyline
vRealize Operations Management Pack for Container Monitoring
SDDC Health Monitoring Solution
vRealize Operations Management Pack for NSX for vSphere
vRealize Operations Management Pack for vRealize Orchestrator
vRealize Operations Management Pack for VMware Identity Manager
vRealize Operations Federation Management Pack
vRealize Operations Management Pack for VMware Integrated OpenStack
vRealize Operations Management Pack for Cloud Provider Pod


Happy Installing/Upgrading.

Hope this article helps you. Please share your comments in the comments section below or follow me on twitter to be updated on similar content - @sunny_dua.


Tuesday, October 8, 2019

Leveraging "Cloud Type" to configure VMware Cloud vCenter in vRealize Operations

With this post, I wanted to share a quick tip which one should follow while adding a vCenter Server running in VMware Cloud on AWS. With vRealize Operations, you can simply point to a VMC based vCenter and gather both vCenter and vSAN metrics from a VMC vCenter.

While adding the endpoint is an extremely simple task in vROps, for VMC, currently, you have to take an extra step to ensure that the vCenter is recognized as a VMC vCenter. This additional setting is called the Cloud Type advanced setting. This setting is available in vRealize Operations 7.0 and above. In vROps 8.0 though this setting would be under a new feature called Cloud Accounts.

With vRealize Operations 8.0 which has been announced at VMworld US 2019, one of the key features which would help you to easily configure endpoints to monitor such as vCenter, AWS or Azure is Cloud Accounts.

Cloud Accounts are a common construct between vRealize Operations 8.0 and vRealize Automation 8.0 as well, which means if you have configured endpoints for provisioning in vRA 8.0, they would automatically be available to import inside vROps 8.0, given vRA and vROps are integrated. More on this would come out in blogs and documentation as the products are GA'ed.

Well, coming back to how we could configure a VMC vCenter cloud account. Here are the steps:

1- Login to vROps with a user with appropriate privileges to create a cloud account / Adapter instance.

2- Click on Administration -> Cloud Accounts

(Note for versions prior to vROps 8.0, the correct path would be Administration -> Solutions. You will select the vCenter Solution and edit the same to add an adapter instance. The rest of the steps remain the same. See this documentation link for more details)

3- Click on Add Account
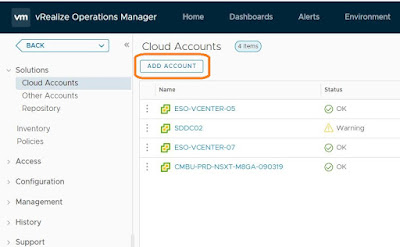


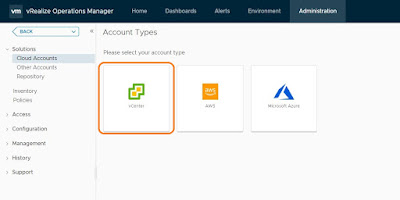
4- Select vCenter 


5- Fill in the details of your vCenter as shown below, and then click on Advanced Settings as shown below.
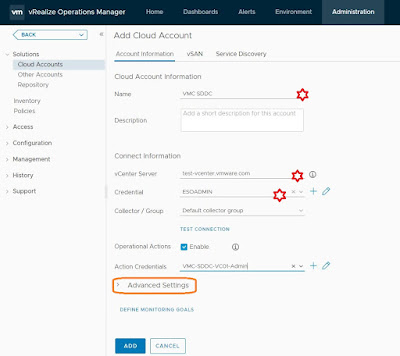


6- Under Advanced Setting, you would notice an option called Cloud Type
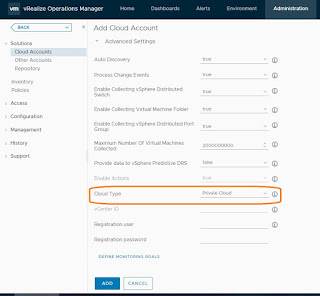


7- For Cloud Type, the default option is "Private Cloud". This is to be chosen when you are running your vCenter on-prem and you are managing it. "Hosted Private Cloud", when a service provider is hosting your vCenter and "VMware Cloud" option when VMware is managing your vCenter.

Select VMware Cloud on AWS


8- If you are running vROps 7.5 or prior, you will save this adapter configuration and then configure the vSAN adapter to collect data from vSAN in VMC. However with vROps 8.0, this is a simple one click enable option within vCenter Cloud Account.

9- Once you have chosen the Cloud Type, click on the vSAN Tab as shown below and enable vSAN monitoring by using the toggle button.


10- You may click on Test Connection or just click on Add to save the Cloud Account and create the required adapter instances to start the collection.


Choosing the right cloud type is important to ensure that vROps understand the vCenter endpoint and apply the correct business logic for use cases such as compliance, costing and monitoring.

I hope this helps... More to come on vRealize Operations 8.0 as it gets ready for a General Availability...

Please share your comments in the comments section below or follow me on twitter to be updated on similar content - @sunny_dua.