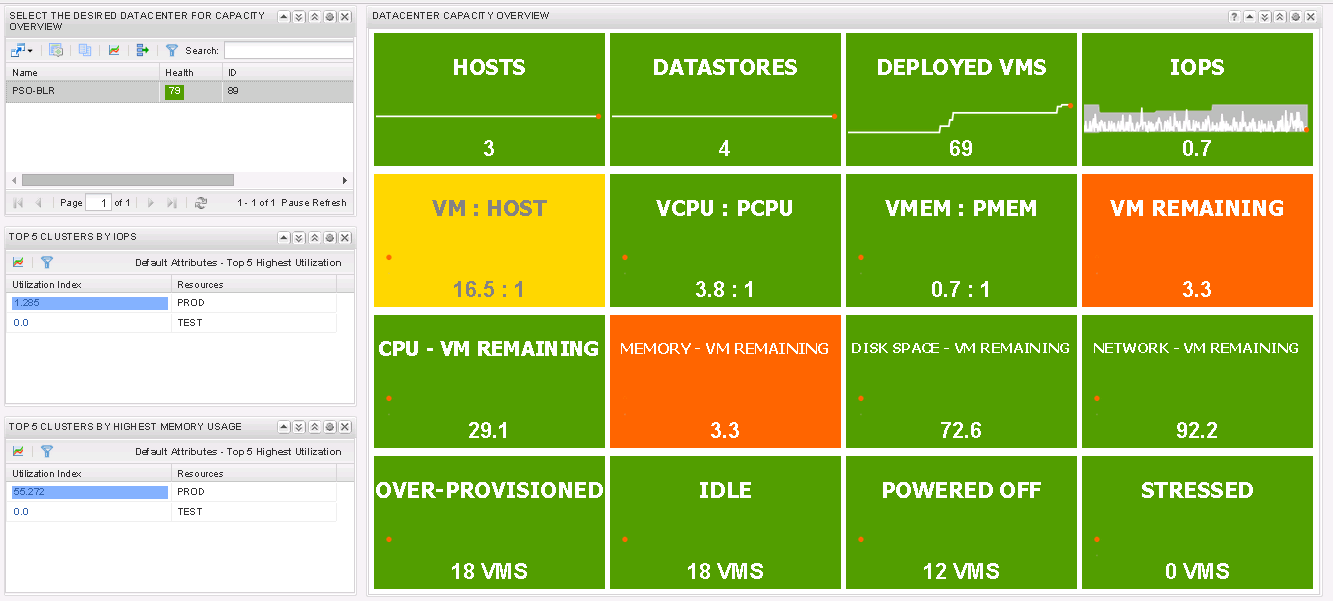
I have got a number of requests in the past to modify the famous Cluster Capacity Dashboard. Today I have modified it to create a similar dashboard which shows the capacity from a Datacenter Point of View. So if you have a large install base of vCenter Operations Manager with multiple Datacenters, you can use this dashboard to have a complete overview of the Datacenter. I call it the Executive Dashboard.
Here is how the dashboard looks like:-
This dashboard allows you to click on the datacenter for which you want to see the capacity overview. At the same time you can see the Top 5 Clusters across all the data-centers with highest amount of IOPS and Memory Usage. As always, I have made it very simple to replicate. You have to download the following files.
EXEC.XML - Click on the link to Download the file and import this to the following location within the UI VM.
/usr/lib/vmware-vcops/tomcat-enterprise/webapps/vcops-custom/WEB-INF/classes/resources/reskndmetrics
Do remember to have this file with the 644 rights to read, write and execute as shown in one of my article from the past. Here is the link:-
Once you have imported that file, you just need to import this another file as dashboard on the vCOps CUSTOM UI. I call it a the EXEC-DASHBOARD.XML (Click to download). In case you do not see the list of datacenters, Edit the Resources Widget on the Left Pane, Browse to Resource Kinds - > Datacenter -> Click on All Attributes once and click on OK. This will get you the list of the clusters and you will be good to go!! -
That's it.. This should do the trick for you. Please share you comments and feedback on how this vCOps dashboard has helped you with your work.
Share & Spread the Knowledge!!
