Showing posts with label vCenter Operations Manager. Show all posts

Monday, October 6, 2014

Creating a One Click Datacenter Capacity & Cluster Performance Dashboard!

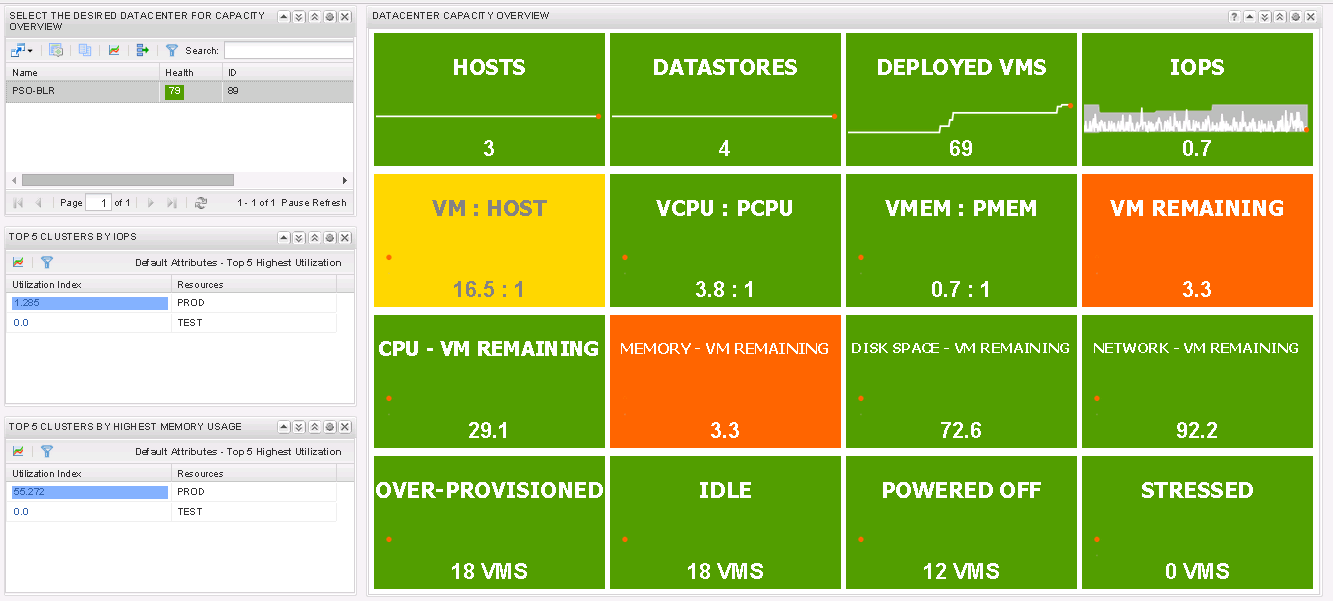
I have got a number of requests in the past to modify the famous Cluster Capacity Dashboard. Today I have modified it to create a similar dashboard which shows the capacity from a Datacenter Point of View. So if you have a large install base of vCenter Operations Manager with multiple Datacenters, you can use this dashboard to have a complete overview of the Datacenter. I call it the Executive Dashboard.

Here is how the dashboard looks like:-


This dashboard allows you to click on the datacenter for which you want to see the capacity overview. At the same time you can see the Top 5 Clusters across all the data-centers with highest amount of IOPS and Memory Usage. As always, I have made it very simple to replicate. You have to download the following files.

EXEC.XML - Click on the link to Download the file and import this to the following location within the UI VM.

/usr/lib/vmware-vcops/tomcat-enterprise/webapps/vcops-custom/WEB-INF/classes/resources/reskndmetrics

Do remember to have this file with the 644 rights to read, write and execute as shown in one of my article from the past. Here is the link:-


Once you have imported that file, you just need to import this another file as dashboard on the vCOps CUSTOM UI. I call it a the EXEC-DASHBOARD.XML (Click to download). In case you do not see the list of datacenters, Edit the Resources Widget on the Left Pane, Browse to Resource Kinds - > Datacenter -> Click on All Attributes once and click on OK. This will get you the list of the clusters and you will be good to go!! -

That's it.. This should do the trick for you. Please share you comments and feedback on how this vCOps dashboard has helped you with your work.


Share & Spread the Knowledge!!


Thursday, September 25, 2014

Building a VDI Custom Dashboard and Generic Scoreboard: Step-by-Step!


A few days back I added a new section to my blog which would bring new bloggers on-board as guest bloggers on vXpress. Today I am proud and happy to share the first post by a Guest Blogger on one of my favorite topic - "No prize for guessing: vCenter Operations Manager" .


This marathon post is by Anand Vaneswaranwho works as a Senior Technology Consultant with the End User Computing group at VMware.  He is an expert in VMware View, ThinApp, vCenter Operations Manager, and vCenter Operations Manager for View. So without further a-do let's see what Anand has to share with this blog post around his experience with the problems he is trying to solve using vCOps for View Dashboards.

This one-click high-level dashboard gathers the most important metrics in a typical VDI environment.  In the event of a production outage, this type of dashboard can be of monumental value.  I encourage you to replicate this dashboard using my example, or simply follow my lead in its setup but leverage the most important metrics, and therefore dashboards, that will be of use to you in your environment.


First, I’m going to structure my dashboard in the following manner (of course, you can structure yours any which way you like).


You can set up the widgets in the manner you want.  To display the number of tunneled sessions through the Security Servers, I’m going to set “Fixed Size” in Layout mode, “Box Height” to 75px, “Label Size” to 12, “Box Columns” to 3, and “Value Size” to 12.  I will name the widget “Security Server Connections,” turn the Self Provider to “On,” and Refresh Widget content to “On.” I will then search for my Security Servers by name in the “Search” field under “List.” However, you could very well sort by Resource Kit as opposed to “Resource” in Selector Mode and navigate to the View Security Servers under resource kind to find your Security Servers.


Once the widget is set up, it will look like this:


Moving on, I’m going to edit the “Health Status” widget right underneath it.  There is little customization needed in this widget, as indicated below, as this is going to be a Receiving Widget with the widget we just created above providing the data. 


Now, I’m going to set up the Interaction as follows:


Once the widget is set up, the resultant widget will look like this:


Moving on to display the Workload % of my Connection Servers on the top right of my dashboard, I will set up my widget in the following manner:


Once the widget is set up, the widget will look like this:


As well, I’m going to edit the “Health Status” widget right underneath it.  There is little customization needed in this widget, as indicated below, because this is going to be a Receiving Widget with the widget we just created above providing the data. 


After that, I’m going to set up the Interaction as follows:


Once the widget is set up, the widget will look like this:


My VDI environment has been segregated into two different vCenters: vCenter 9000 hosts the full-clone workload clusters while vCenter 9003 hosts the linked-clone workload clusters.  But I’m going to need to find a way to group these hosts into their appropriate vCenter (in vCOPS) so I can achieve this granularity when displaying data in my widgets.  

So this is where the built-in vCOPS feature of Resource Tags comes in handy.  To get there, I’m going to navigate to Environment > Environment Overview, and click the  'spanner' icon to manage tags.  Then, I’ll add a tag called “vCenter Hosts” and add Tag Values called “9000” and “9003”.


Once I’ve set up my tags, I will drag my ESXi hosts into the appropriate tags so that my final output looks like this:


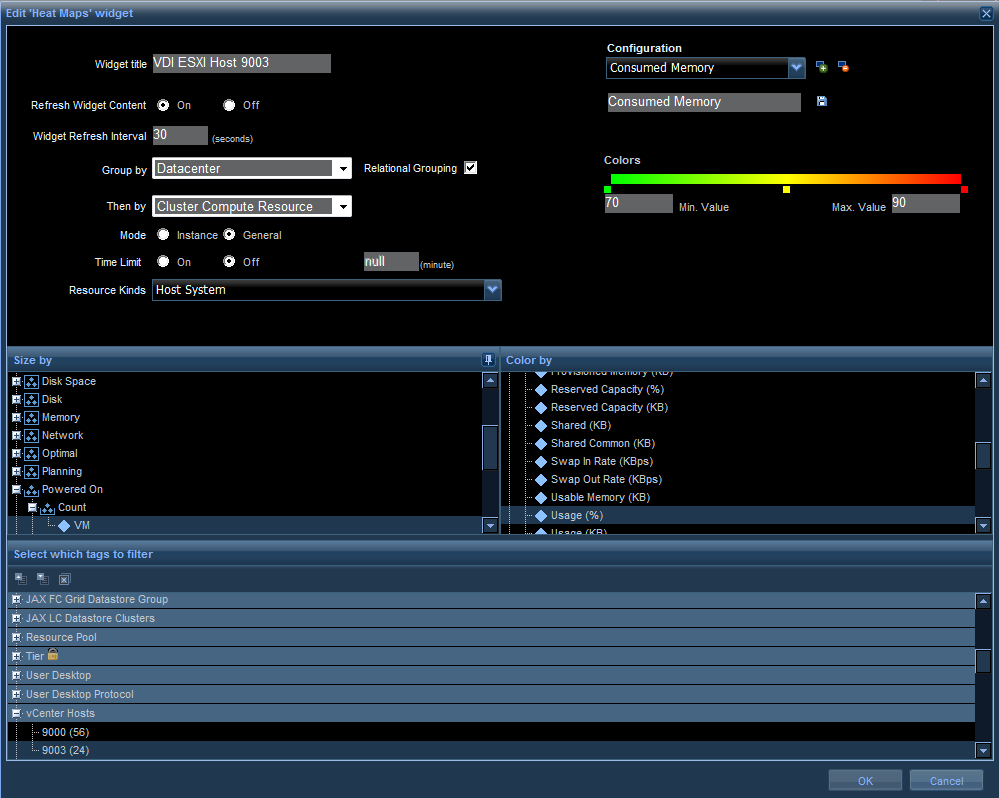
After this step, I’m ready to edit my Heat Map widgets.  First I will edit the Heat Map to the bottom left of the dashboard and set up the following Heat Map configurations:


Overall Workload


Consumed CPU


Consumed Memory


Now I’m going to replicate the same configurations on the heat map widget to the bottom right for my 9003 hosts.

Overall Workload


Consumed CPU


Consumed Memory


Now we move onto the bottom middle widget which I want to set up to monitor the performance and capacity of my datastore LUN’s.  First, I am going to perform a similar grouping of VDI LUN’s as either belonging to either 9000 or 9003 vCenter.  I’m also going to create another tag value for replica datastores so I have an easy way of filtering them out.  I will then drag my LUN’s to the appropriate tags.


Next, I’m ready to edit my Heat Map widget.  I am going to set up the Heat Map configurations as follows:

Storage Available


Performance


Density Non Repla


Density Repla


Finally, for the Heap Map widget that is situated on the top-middle of my dashboard, I am going to monitor resources on critical VDI servers.  Once again I’m going to set up my tag-and-drag objects into the dashboard as appropriate.


Next, I’m going to set up the following configurations on the Heat Map:

Server CPU


Server Memory


Server Disk


After completing all of those steps, we are done. And now we can reap the fruits of our labor with this final output which looks like this:


In summary, I’d like to share few things to keep in mind:

  • If you want a quick graphical representation of the overall high-level state of your environment in a troubleshooting circumstance, or merely show your manager with a quick at-a-glance view, the Generic Scoreboard, Health Status, and Heat Map widgets are your best friends.
  • Resource Tags are extremely helpful when you need to find a way to granularly segregate your objects, especially when you filter in the Heat Maps.
  • My last word of advice, and it may be obvious, but if you feel apprehensive about this task, I’ll tell you what I tell customers: vCOps is nothing but a bunch of customizable dashboards with a bunch of customizable widgets.  The widgets contain a bunch a customizable data that you can resize and chop any which way you like.  BOOM! There you have it.

In my next series, I will write about creating a custom dashboard that delves into details on current capacity for each of the High-Level configurations we have captured in this dashboard.

Before the post concludes - A special thanks to Anand. Please leave your comments and feedback for him if you like his post and appreciate the hard work behind writing this. Motivation is what keeps the community going :-)


Share & Spread the Knowledge! 


Thursday, July 24, 2014

Part 12 - Deleting Unwanted or Stale Resources from vCenter Operations Manager!

In a number of projects I do, I have always noticed that customers have tried to add their test & development vCenter servers, remote site vCenter servers etc. to their production vCOps instance to see if vCOps is able to monitor all the instances across the sites. This could also happen if you by mistake register all the vCenter Servers in a Linked Mode Configuration on the admin page. Later on they realized that they want to use vCOps only for one of the sites and then got rid of the other vCenter Servers.


Now as good as it sounds, it does not really help the vCenter Operations Manager Database as this can result into a number of junk values in the databases which will not be cleared off unless you tweak certain advanced settings in the vCOps collector properties.


Let's have a look at two methods which can adopt to do this. One is manual and the other one in automated. I will show you both and leave it up-to you to chose what you think is right for your infrastructure.


Option 1 - Manually remove resources from Environment Tab

1- Login to vCOps Custom User Interface (Only available with Advanced and Enterprise Edition)

2- Click on Environment - > Environment Overview

3- Here you can see all the Resources which are registered with your instance of vCOps. For resources which you do not require or are stale, select them and click on the Delete Resource icon as shown below:-


Needless to say that this is painful if you have added multiple sources and you are not even sure what should stay and what should go away. If that's the case follow Option 2.

Option 2 - Editing Collector Properties for Deletion of Stale Objects

1- Login to vCOps AnalyticsVM via a ssh client such as putty.

2- Browse to the following directory 


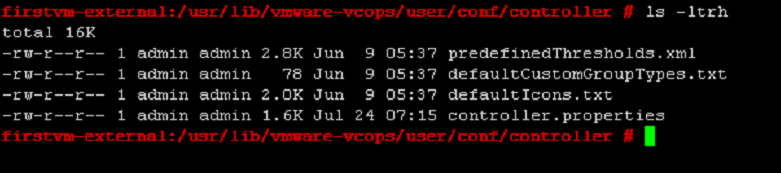
3- Edit the controller.properties file and look for the following values which define the retention period of stale or absent objects


deleteNotExisting = true - Simply means that you want to do a cleanup of resources which are non existing in the vCOps instance. This setting is set to FALSE and should be changed to true for you to cleanup all the junk you don't want.

deletionPeriod = 15 - If the policy is set to delete non existing resources, then they will be deleted post 15 days of there non-existence as per this setting. Change this to 1 Day if you want to cleanup junk resources within 24 hours.

deletionSchedulePeriod = 24 - This setting defines how often vCOps checks for Not Existing Resources.


Once you are done with editing the file, just sudo to the admin account and restart the vCOps Services as shown below


Guess what you are DONE :-)

I would highly recommend that if you are not proficient with Linux commands and editing files, then use Winscp to browse to these files, download them, edit them on a text editor and then upload them back in the system. Stay tuned for more vCOps fun coming your way soon... Till then!

*******************************UPDATE 29-July-2014*******************************

As per the comment from Jon Hemming, I am updating the article with the the information shared by Jon. As per the VMware KB 2020638 originally written by him, he has mentioned:

With vCOPs 5.7, deletionPeriod = 15 is renamed to deletionPeriodInHours = 360 and is, by default, commented. Ensure to uncomment this line.

Thanks Jon :-)

Share and Spread the Knowledge!


Thursday, June 5, 2014

Part 11 - Creating Policies & Configuring Badges in vCenter Operations Manager!

It's been over a month since I wrote about vCOps. With this article I wanted to start sharing some of the content which I am creating as a video series around configuration of policies in vCenter Operations Manager. 

This article and the upcoming articles will all be a part of the Back to Basics series on vCenter Operations Manager which I started in March this year. 

Here are the links to the first Ten Parts :-


In this part I will discuss the Basic Function of policies and configuring badge thresholds. From here I will take you to capacity and time remaining calculations and then the rest of the configuration options in vCenter Operations Manager. Here is the video:-

Creating Policies & Configuring Badges in vCenter Operations Manage


Stay tuned for some more stuff video stuff on vCenter Operations Manager. Till then...


Share & Spread the Knowledge!!


Thursday, April 24, 2014

Part 1 - vCOps Extensions - Managing Operations Beyond Virtual Infrastructure

This is a season of Multi-Part Series on vXpress, especially around vCenter Operations Manager and Architecting vSphere. Sometimes this can mean that you need to wait for the next post in the series & I apologize for that. Since blogging is not a part of my Job, it becomes difficult sometimes to get all the content out at once. I write when I get to write which in the past few days has been difficult with lots happening in bother personal & professional life..

Anyways enough about me, lets talk about some COOL stuff which you can do with vCenter Operations Manager. With all my posts on vCOps, you must have noticed that all this while I was concentrating on using vCOps to manage the VMware Virtual Infrastructure. However with this exclusive series on vCOps Extensions, I would just focus and talk about the various plugins which are available to extend the vCenter Operations Manager Analytics engine to beyond your virtual infrastructure & to each nook and corner of your datacenter equipment. 


It is important to know that you need to be on Advanced/Enterprise edition of vCenter Operations Manager to use the capability of extending vCOps beyond the Virtual Infrastructure. 


Use Cases Beyond Virtual Infrastructure

Before I get into the the meat of this post, I wanted to share a use case which I was told about when I was first introduced to vCenter Operations Manager. In this case vCOps Custom Dashboard were used by a bank to fetch data from their EPBAX (Business Telephone Systems) into vCOps and then create custom dashboards for monitoring the call patterns which were coming into their call center. They could easily get call patterns and if their were abnormal call patterns in a particular queue, they would know it with the Anomalies feature of vCOps.

This would help to proactively know about the issues which their telephone lines, websites, internet banking systems etc might have or will have. This would also help them forecast the call patterns and workforce needs to handle them. I don't think their could be a better example of how creative you can get with vCenter operations manager.


Available Integrations

It is quite obvious that  their are a number of default integrations which are available today through adapters which can be easily installed and configured on your existing vCOps deployment and start bringing in the metrics from the third party resources such as storage arrays, networking equipment, applications etc. All such adapters are available on the VMware Solution Exchange Page for Cloud Operations Management.

As I write this post, there are 48 such management packs available which can be used for different purposes. There are more than 100 documents which can help you with the implementation of these management packs.


What's Next

With this series I will try and showcase some of the possible integrations which we can do with all I have in my PS Lab out here in India. I will post my experience with these integrations as and when I execute in the parts to come.

Soon coming out with the next part which is going to talk about monitoring the storage infrastructure with vCenter Operations Manager.

Stay tuned for more...


Share & Spread the Knowledge!!


Thursday, April 17, 2014

vCenter Operations Manager 5.x - FAQ Repository!

With the amount of work I have been doing on vCOps, I do get a number of questions on various platforms such as Twitter, Facebook, LinkedIn and on my posts around various things which people want to know. Although a great solution, it was not marketed the way it should have been and hence the awareness is missing. This is my attempt to make it easy for people to get some of the basic answers about the product on a single page. 

I will keep updating this PAGE as and when I get questions which I think will benefit the larger audience and will post it through the twitter and other social media channels. We will go in descending order to ensure you get the latest FAQs on the top of the list.

For getting updates regularly, I would recommend, you subscribe to vXpress and Follow me on Twitter..


vCenter Operations Manager 5.X - Frequently Asked Questions

*** Last Update Date - 17th April 2014 ***

FAQ 2 -  (Muditha Gayan Dissanayaka) - I just want to know one thing, how can I get a report of actual memory usage of VMs ? Because all the reports generated by the vCOP are depend on Active memory or some other thing...

RESPONSE - Great question... But what we need to understand is that Memory Usage is a thing of the past. vCOps uses the concept of derived metrics and not the primitive metrics such as usage. Usage is a virtual world can be incorrect data as we are taking about a shared infrastructure where, Memory & CPU are shared. Hence it will make sense to look at DEMAND rather than usage.. Demand is a derived metric which is a combination of Active memory + overheads.. That's the real utilization from the Guest OS perspective. Would recommend vCOps Analyze and Predict training which can help you drill down in the concepts...


FAQ 1 -  (Muditha Gayan Dissanayaka) - One thing I want to know, how can we tell to our customers to adjust allocated memory by analyzing DEMAND in order to maximize the memory utilization, because DEMAND is very small compare to allocated memory.As an example allocated memory to an Exchange Server is 16 GB, but DEMAND will be 3-4 GB !!!!, I just want to know a proper metric or an equation to suggest our customers like " 10 GB memory allocation is enough to this Exchange Server "


RESPONSE - I think your query is more related to the Over-sized VM Report which can sometimes be crazy to show to an application owner as it completely gives recommendations on the basis of Demand and not usage. 


There are 2 things which we need to keep in mind:- 

a) vCOps in its current Avatar, does not have the option to key in the bare minimum requirement for the OS or an application which is required to get support from an OS or Application vendor, hence you cannot just blindly rightsize the VM as per the recommendation in the report. You need to start with shaving off 15 to 20% to see the application behavior but yes, you cannot go below supported minimums. Eg. you cannot go on 512 MB of RAM on a Windows 2008 Server OS, since the minimum required and supported by MS is 2GB. I would so any rightsizing by taking the minimum required for support + demand + 20% buffer for Peaks and then come out with the final size. 

This might be an enhancement you might see in the future releases. 

b) Another thing to keep in mind is the policy which you have defined for the Oversize VM calculations. It is the most understood thing in the product and I will work on a blog post soon to explain it.. Just to let you know, I recommend a setting of 80% instead of the default 1% of the time. That will give you more real world results. 


Share & Spread the Knowledge!!