Showing posts with label vcops scoreboard. Show all posts

Thursday, March 13, 2014

Part 2 - Behind the Scenes - vCOps One Click Cluster Capacity Dashboard!

As promised in my last post "Part 1 - Creating One-Click Cluster Capacity Dashboard Using vCOps!", I am going to share the recipe for preparing dashboards similar to "One Click Cluster Capacity Dashboard" which received a lot of appreciation from the Twitterati. Their were a number of people who deployed the dashboard and within minutes they could showcase the capacity of their vSphere Clusters. 

Now I want to take this one level deeper and tell you how you can create your own cool XMLs within vCOps Custom UI (included with Advanced & Enterprise Edition) to create the dashboard which you want to showcase to your CxO, IT VP or the NOC team who are monitoring the virtual infrastructure. In simpler terms I will call it the BEHIND THE SCENES post which will get into XML coding. It's way easier than I thought so go ahead, read on....

To begin with let's have a look at the XML file which I created for Scoreboard interactions in Part 1 of this 2 post series. Here is how the file is structured and the details of the components which make up this file. Understanding this is CRITICAL...
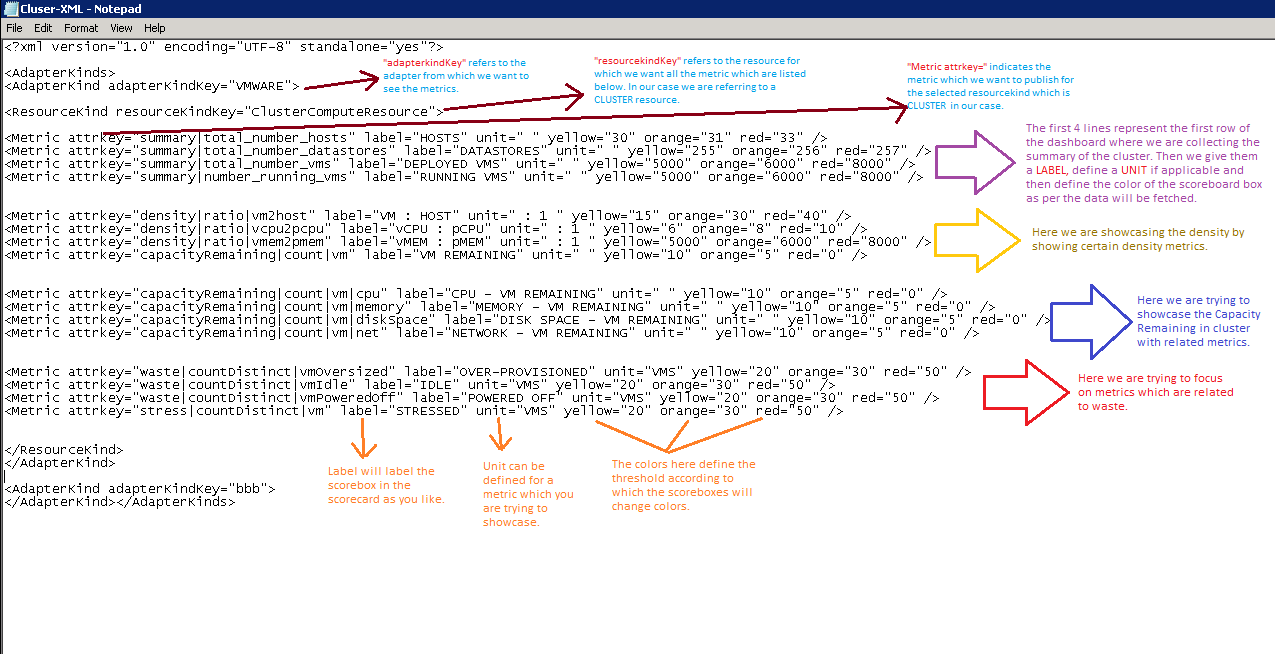


HINT - OPEN THIS IMAGE ON A DIFFERENT PAGE TO READ ALL THE GOODNESS


Now if you have spent some time reading the details of the image above, the first question you will have is that from where can I find the adapterkindKey, resourcekindKey & the Metric attrkey to make my DREAM DASHBOARD.

Honestly, if this is not the question which you have in your mind, then you need to re-open that image and go through the structure AGAIN & AGAIN. You would not need to as it is very simple, but I am just making sure that we are on the same page before we move forward.

Let's see from where can we get the above parameters which can help us make our own XML.

adapterkindKey - This is the easiest one. Mostly you will be using VMWARE as the adapter kind if you want to see metrics from your vSphere Environment. If you have collectors installed for 3rd party products then refer to their documentation for the adapter name. 

resourcekindKey & attrkey - To get this data you need to access the database of vCOps which has stored these keys. The procedure has been defined in VMware KB - 2011714.

Let me simplify it for you further. You need to follow the steps below.

1- Open the following URL in your environment - 

https://<ip address of UI VM>/vcops-custom/dbAccessQuery.action


2- Once you see the vCOps DB Access Query page, you need to run the following query. This will fetch the data we are looking for. Ignore the *** You need to copy and paste the query from SELECT and end at 'HostSystem'

*********************************************************************************
select a.ADAPTER_KIND_ID, a.ADAPTER_KEY, b.RESKND_ID, b.RESKND_KEY, e.ATTRKEY_ID, e.ATTR_KEY
from AdapterKind a
 inner join ResourceKind b on (b.ADAPTER_KIND_ID = a.ADAPTER_KIND_ID)
 inner join AliveResource c on (c.RESKND_ID = b.RESKND_ID)
 inner join ResourceAttributeKey d on (d.RESOURCE_ID = c.RESOURCE_ID)
 inner join AttributeKey e on (e.ATTRKEY_ID = d.ATTRKEY_ID)

 where a.ADAPTER_KEY = 'VMWARE' or b.RESKND_KEY = 'HostSystem'

*********************************************************************************

You would need to change the values highlighted in blue in the query if you are looking for keys related to an adapter other than VMware.


3- The query will give you all the data which you were looking for in the following format. (Screenshot from my lab)
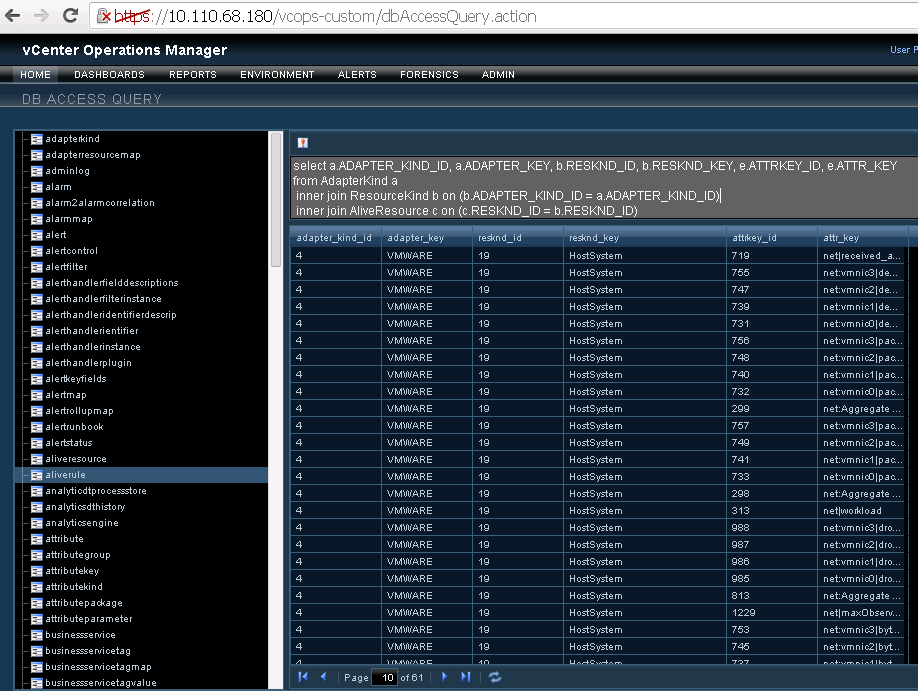


Here, you will see the resourcekindKey & attrkey which will help you to create your own XML for the values which you want to showcase for a particular resource. Once you have done that, you just need to import this XML into the default interactions location mentioned in my last post and you will be ready to use it for Score Board interactions.

THAT IS IT!!

Well, I hope you will use this recipe to good and I would appreciate if you can share the XMLs which you create with this recipe as I am planning to have a repository on my blog with some dashabords which are easily re-usable and can help the VMware Community using or planning to use the vCenter Operations Manager. As always, share your thoughts/ideas in the comments section.

PS: Please VOTE for vBLOG 2014 Contest.  We (vCommunity Bloggers) need your support to keep us going and continue delivering the quality content to you. 

Share & Spread the Knowledge!!


Sunday, March 2, 2014

Part 1 - Creating One-Click Cluster Capacity Dashboard Using vCOps!

Let me start this article by thanking & welcoming  VEEAM as the first official sponsor of vXpress. Their support to the Virtualization community is invaluable. I would request my readers to have to look at their excellent range of products which helps you Protect & Manage your virtual infrastructure in an effective & modern way. You can know more about them by clicking on the Sponsor Banner from Veeam on the right hand pane of this page.

With this article (Part 1), I wanted to share my recent experience and work I have done with vCenter Operations Manager Custom Dashboards. In the past I have written articles which help you create your own .XML files for creating interactions within vCOps Custom Dashboards Widgets. With this article I wanted to take the same interactions and customization to modernize and transform the Executive Capacity Dashboard I created & shared with you all in this post.

Let me begin with sharing the FINAL OUTCOME i.e. the dashboard which I created and the problems it is going to solve and then we will have a look at the process of designing this dashboard & the related customization. 


Here is a quick summary & features of this dashboard:-

-> On the left pane you have the list of CLUSTERS in the environment being monitored in your Virtual Infrastructure.

-> Once you select a given cluster you get the Capacity Overview of the cluster on the right hand scoreboard widget.

-> The Scoreboard gives you the Summary of the Cluster, Consolidation Ratios, Capacity Remaining, Waste & Stress Data.

-> The Colors with each score is either on the basis of VMware Configuration Maximums. (For Eg. if the number of hosts comes out to be 33, the box will turn RED as vSphere 5.x currently supports a 32 node ESXi Cluster. You have the options of defining these thresholds while creating the XML which I will share shortly.

-> This dashboard can help CXOs to get the details of the capacity of each cluster at a click of a button and can easily help them make procurement decisions.

-> This can help IT teams to quickly decide which clusters can be used for any new Virtual Machine Demand from the business, etc.

-> This can help large service providers to keep a tap on the resource utilization and available capacity at a click of a button.

The beauty behind this customization is that this dashboard can be exported right from my vCOps instance and imported into any vCOps instance with a few steps and it will work like a charm. With this part, let me just share the way by which you can successfully RE-USE this dashboard in your vCOps instance, given you have the vCOps advance or Enterprise edition, since you need the Custom UI to view this.

In this Part 1, I will guide you with steps on how to get this dashboard in your environment. In Part 2, I will explain on how you can create the interaction xml which will help you create more such interactions as per your own requirements. This Dashboard requires 2 XML files. Click on the files to download them.

Cluser-XML.xml 

Cluster-Capacity Dashboard.xml 

The Cluster-XML.xml file is the one which has all the metrics which I am trying to display in the scorecard on the right as soon as a cluster is selected on the left pane. I will tell you how to write this file in the Part 2 as I mentioned earlier. The Cluster-Capacity Dashboard.xml  file is just a simple export of the dashboard from the Custom UI. You can do the same for any dashboard which does not have any dependencies for resource ids (unique identity number given by vCOps to each of its inventory object). You would take a 2 step approach to use these files to get the final result.

STEP 1 - Place the Cluser-XML.xml in a specific location of the UI VM

1- Use an SCP software to login to the UI VM using the root credentials. I am using WinSCP.

2- Change the directory to the following location /usr/lib/vmware-vcops/tomcat-enterprise/webapps/vcops-custom/WEB-INF/classes/resources/reskndmetrics

3- Drag and drop the Cluster-XML.xml file from your system where you downloaded it to this directory as shown in the screenshot below.


4- Right click on the target file and click on Properties to change the permission level to 644 (For Read & Execute rights) as shown below.


You are done with STEP 1. Let's look at STEP 2.

STEP 2 - Import Cluster-Capacity Dashboard.xml  dashboard in vCOps Custom UI

1- Login to vCOps Custom UI with an ID with Administrative Privileges.

2- Click on the Import Option under Dashboard Tools.


3- Browse to the location where you have saved the Cluster-Capacity Dashboard.xml and click on Import.


4- You will get a dialog box that your dashboard it successfully imported. Close the same and click on the Dashboards Menu to find a new dashboard named "CLUSTER-WISE CAPACITY OVERVIEW"


5- Click on this and you will get the dashboard which we saw in the beginning of this post. Ain't it simple :-)

6- In case you do not see a blank dashboard, Edit the Resources Widget on the Left Pane, Browse to Resource Kinds - > Cluster Compute Resource -> Click on All Attributes once and click on OK. This will get you the list of the clusters and you will be good to go!!


In the next part I will explain you that how you can create your own .XML files to create more dashboards which are useful for your organization. Would appreciate a re-tweet / share and a comment on this article if you find it interesting and the dashboard useful for the bosses who want a single pane to have a look at the entire capacity of your Virtual Infrastructure.

Before I close this article, I would also want to highlight that, Lior Kamrat, who like myself is a part of VMware Consulting group has started to accumulate all the great resources available on vCOps on a dedicated page on his blog called IMALLVIRTUAL.COM. I would highly recommend you bookmark the page if you are using, learning about or want to become an expert on vCenter Operations Manager. He has also done a blog series on One Click Capacity Planning Dashboards which gives you another angle of Capacity in your Virtual Datacenter. It is a must read as well.

Stay tuned for Part 2 and also please do not forget to VOTE for vBLOG 2014 Contest.  We (vCommunity Bloggers) need your support to keep us going and continue delivering the quality content to you. 


Share & Spread the Knowledge!!