Showing posts with label customize vcops. Show all posts

Thursday, September 25, 2014

Recover Deleted Custom Dashboards from vCenter Operations Manager

Some time back, I wrote an article highlighting the custom dashboards which are available out of the box with the release of vCenter Operations Manager 5.7. I have been asked questions about, how these dashboards can be recovered in case someone deletes them accidentally. 

In reality these dashboards are a bunch of XML files which get imported as dashboards, when you install the vCOps vAPP for the first time. A shell script is behind this import which executed the script post installation and start importing these out of the box dashboard in your vCenter Operations Manager instance.

Hence, if comes a scenario where you end up deleting these dashboards, you would need to find that shell script and run it all over again to import the dashboards back into your vCOps instance. Now that we know the science behind these dashboards, let's have a look as to where this shell script is located. 

I am using WinScp to login to the UI VM and browse through to the /usr/lib/vmware-vcops/user/conf/dashboards directory as shown in the screenshot. Here you will find the shell script "import-dashboards.sh"  and most importantly all the xml exports of the dashboards which can be imported back into vCOps individually as well.


If you wish to import all the dashboards, you would need to execute that shell script using either a ssh client such as putty or by taking a console connection to the UI VM. If you run this script it will import all the dashboards listed in the screenshot above and if any of those dashboard is already existing then you will have duplicate instances of same dashboards which in my opinion is not cool.

Hence if you want to recover only a subset of the listed dashboards, then either edit the shell script (if you are good with scripting) else just grab the xml file you want to import and use the IMPORT DASHBOARD option in the custom UI.


With this I will close this article and  get on with a 360 Degree Capacity Dashboard I am working on. Will share that for sure ;-)

Till then...


SHARE & SPREAD THE KNOWLEDGE!!


Thursday, October 24, 2013

Creating vCenter Operations Manager Dashboards Using Customized Interactions Mode.

In my recent vCenter Operations Manager projects, I have extensively worked on customizing vCOps for customers to meet the needs of their specific use cases. In one such engagement, I was asked to build up a custom dashboard which shows all the key metrics of a selected object. The use case of this dashboard is to showcase 3 heatmaps, one each for Virtual Machines, ESXi Host and Datastore. These heatmaps would change colors from Green to Red once there fault score changes from 0 to 1. As soon as there is a fault with any of the VMs, Hosts or Datastores the color of the object changes to RED. Later you can click on the object and it will show the key metrics related to that object in the right pane (metric spark-lines). Look at the screenshot below:-

FAULT - METRIC DASHBOARD

Figure 1


This is possible using Heatmap widget on the left which showcases Faults and Metric Sparklines widget on the left. Then an interaction has been set between widgets as sown below in the screenshot.

Figure 2


These interactions are used by setting up the interaction mode in the Metric Sparklines and other similar widgets. Here is a screenshot which shows where the interaction mode is set:-

Figure 3
In the default mode the Interactions Mode shows the metrics which are shown in the above screenshot as soon as you select the object, however the requirement which I got was different.

I was asked to create a custom list of metrics which should be shown as soon as a VM, ESXi Host or a Datastore is selected from the heatmap. To meet this requirement, I had to find a way by which I can set the interaction mode to point towards a custom XML which would then show the desired metrics on the metric spark lines.

The custom-metric.xml which I wrote is shown below along with its description below:-

Figure 4


You can download this file from the following link - https://docs.google.com/file/d/0B9F7kU-3lhdfUWNvRXJTNUR0ejA/edit?usp=sharing

Once you have downloaded this file, you can change the thresholds or define new metrics or objects to solve your use cases. In order to get the details of all the metrics which are available for an object, you can login to vSphere UI and navigate to the operations tab as shown in the screenshot below:-

Figure 5


Your next task would be to upload this xml on the vCOps UI VM . Once it is uploaded we will be able to use this file for interaction instead of Default mode as shown in Figure 3.  The path on UI VM where u need to store this - 

/usr/lib/vmware-vcops/tomcat-enterprise/webapps/vcops-custom/WEB-INF/classes/resources/reskndmetrics

I will use winscp to move the "custom-metrics.xml" file to the above mentioned location on my UI VM and then give it the exact rights as other existing files which are available in this directory as shown is Figure 6 and Figure 7 below.

Figure 6


Figure 7


Alright, now we just need to edit the dashboard which I showed in Figure 1  and edit all the 3 widgets for VM Sparklines, ESXi Host Sparklines and Datastore Sparklines and click on the drop-down below Res. Interaction Mode to select the brand new interaction option which we just created and uploaded. See the screenshot below and you will notice the new custom-views option which is available now. Make sure to set this interaction mode for all the metric spark-lines widgets on by one.

Figure 8


Once you are done, you need to just select any VM, Host and Datastore in the left pane and now you will see the metrics which you asked for in the custom-views.xml file. See Figure 9 below and compare it with Figure 1 and Figure 4 and you will notice that the metrics shown now are the metrics which you defined in your xml file.

Figure 9


Now this can be really powerful as you can use this customization method to filter the metrics which you want in a dashboard rather than depending upon what is available out of the box. Let me know if you have any questions on this and I will be happy to help you.


Share and Spread the Knowledge. 


************Article Update - 27th Oct 2013*************

Another update to the article on the basis of discussions I had with my buddy Lior Kamrat. He has done some great work on vCOps and XMLs. If you have a super metric which you want to capture as an attribute key, you need to use the following format:-

"<Metric attrkey="Super Metric|sm_X" (X as number(ID) of the SM)


************Article Update - 25th Oct 2013*************

In the comments on this article, Matthew asked a question on how to get the "Metricattrkey" for a given metric. Please find my response in the comments section and also see Figure 10 below.

Figure 10


Tuesday, October 22, 2013

Preview of Custom Dashboards Available With vCenter Operations Manager 5.7.x.

With this blog, I wanted to showcase the power of custom dashboards in vCenter Operations Manager. In the past I have written about creating custom dashboards with vCOps. I would encourage you to read all those articles before you read this one. An easy way to access all those articles is through the page dedicated to vCOps on vXpress.

As mentioned in my introductory article about vCOps, the solution comes with 3 different user interfaces. In this article I would specifically talk about vCOps Customer User Interface.

With vCOps 5.7.1, VMware decided to provide some excellent custom dashboards pre-built into the solution. If you go through the release notes of the product, you would see the following section which talks about these dashboards:-

vSphere Dashboards in the Custom UI


The vSphere group in the Dashboards menu contains several default dashboards for managing virtual objects in a vSphere environment. These default dashboards are available to all members of the Administrators, Operators, and Users user groups. This release introduces the following default vSphere dashboards:

  • Troubleshooting Dashboard
  • VM Utilization Dashboard
  • VM Performance Dashboard
  • Host Utilization Dashboard
  • Cluster Utilization Dashboard
  • Datastore Performance Dashboard
  • Datastore Space Dashboard
  • Heatmaps Dashboard
  • Alerts Dashboard
  • Host Memory Dashboard

Let me run you through all these dashboards and show how you can use them in day to day operations management.

While in the previous release of vCOps, you required to create all the custom dashboards, the above mentioned release comes with these custom dashboards. The screenshot below showcases how these dashboards can be accessed and used.

To being with, let's log on to the vCOps Admin UI to check the version of vCOps I am running in my lab environment:-

1- Login to vCOps Admin UI - https://<admin ui ip address>/admin

2- The username to be used in 'admin' and the password is 'vmware' by default if you have not changed it during initial setup.

3- Click on the status tab and you can check the version of vCOps, you can see I am running 5.7.2 in my environment.


4- Now lets log on to the Custom UI - https://<admin ui ip address>/custom

5- Click on the Dashboards Tab -> vSphere (this lists all the custom dashboards which are incorporated in the 5.7.x realease:-


Lets ho through each dashboard one by one to see how it helps you to manage your VMware infrastructure:-

VM Performance Dashboard (click the image below to enlarge)

This dashboard showcases the key performance statistics of  top 25 virtual machines in your environment. This includes some of the key parameters such as CPU Ready%, Memory Swap In Rate, Memory Swap Out Rate, Write Latency, Ready Latency, Disk Commands Per Second (IOPS), Network Packets sent and Received Per Second.


Troubleshooting Dashboard (click the image below to enlarge)

This dashboard sis pretty interesting as it helps you to troubleshoot and find out the culprit objects for any performance problems in your virtual infrastructure. Here you can select an object you want to investigate, see its relationship with other objects in the virtual datacenter and also find out interesting metrics and latest events associated. This will help you to zero down on a root cause by correlation which can be a big help while troubleshooting issues.


VM Utilization Dashboard (click the image below to enlarge)

As the name suggests, this dashboard is focused on giving you utilization statistics for your virtual machines in your virtual datacenter. The dashboards uses the Top 'N' Analysis widgets to show the Top 25 VMs with CPU Usage, Memory Usage, Disk IOPs, Network Packets Sent and Received.


Host Utilization Dashboard (click the image below to enlarge)

As the name suggests, this dashboard is focused on giving you utilization statistics for your ESXi hosts in your virtual datacenter. The dashboards uses the Top 'N' Analysis widgets to show the Top 25 ESXi hosts with CPU Usage, Memory Usage, Disk IOPs, Network Packets Sent and Received.


Cluster Utilization Dashboard (click the image below to enlarge)

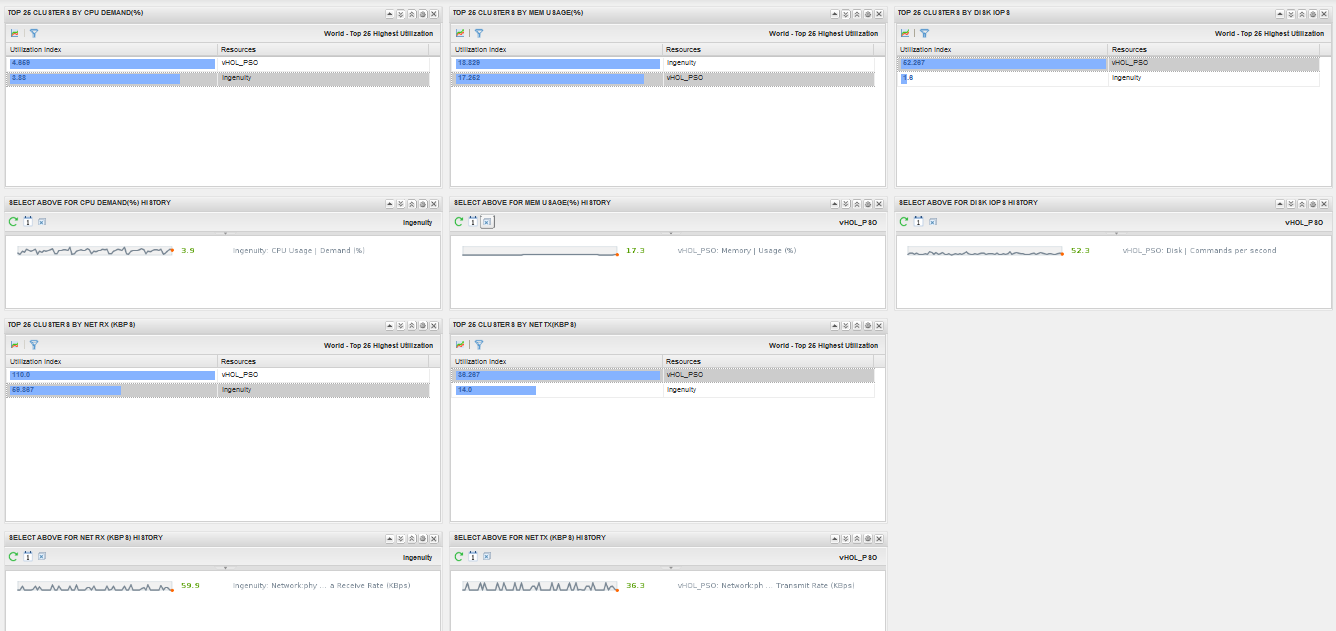
This dashboard can be used to focus on the resource utilization at a cluster level. It clearly indicates how much is used and available which can give you a clear picture around resource utilization in your clusters. This includes CPU Demand, Memory Usage, Disk IOPS, Network packets send and received.


Datastore Performance Dashboard (click the image below to enlarge)

This dashboard is by far the best resource I have used to troubleshoot performance issues in a vSphere infrastructure which are primarily due to issues in the underlying storage issues. This dashboard lists the top 25 Datastores with highest Latency and IOPS. The good part is that you can select the object (datastore) and see which VM within that datastore is driving the latency or IOPS. This is an easiest way to find the culprit VM or datastore.


Datastore Space Dashboard (click the image below to enlarge)

This dashboard helps you keep a track of the occupied space in your datastores. This is similar to the custom dashboard I showcased in my article - Using vCOps Super Metrics & Custom Dashboards to Display Datastore Usage % !!

You can select the datastore on the left which is showcasing the space remaining on the basis of colors, red being less space and green being enough space. On the right pane it shows the VMs which are utilizing this space and the widget below shows the metric sparklines.


Heatmaps Dashboard (click the image below to enlarge)

Heatmaps are a good way to showcase utilization and load with the effect of changing colors. This dashboard helps you to understand the load of your Virtual Environment across clusters 7 ESXi hosts. The metrics measured here are CPU, Memory, Disk and Network.


Alerts Dashboard (click the image below to enlarge)

I do not have a screenshot for this dashboard as I do not have any alerts in my virtual infrastructure. But yeah this alerts dashboard helps you to deal with all the alerts with the health of all the related objects and interesting metrics. This can help you do a 1st level root cause for the issue for which the alert is generated.

So you can see that there are a number of goodies available in the product out of the box. I would encourage you to upgrade the environment to 5.7.x release so that all these dashboards are automatically created in your vCOps Custom UI and you can use them to monitor your infrastructure more efficiently. Also try my other vCOps custom dashboard articles to learn how to create a custom dashboard.


Share and Spread the Knowledge.